One of the things I’ve had to learn about transitioning into a more creative and visionary role with my new job is to change the way I think about when and where work gets done.
The most important thing about creative work is that it gets completed by your deadline. Everything else is secondary.
I’ve always worked remotely, but in my past two jobs, my remote work required me to be at my desk to handle incoming requests. Even going out to lunch was stressful because I didn’t want to have to take a Skype call from a client at the local sandwich place. When 5 years of working means 5 years of being at your desk from 9am to 5pm, this is a difficult mentality to break.
I started out the day being unable to focus. By lunchtime I was getting worried and feeling bad about not getting enough done. Then after lunch I asked myself a question: “Do I need to be at my desk to get this planning done?”
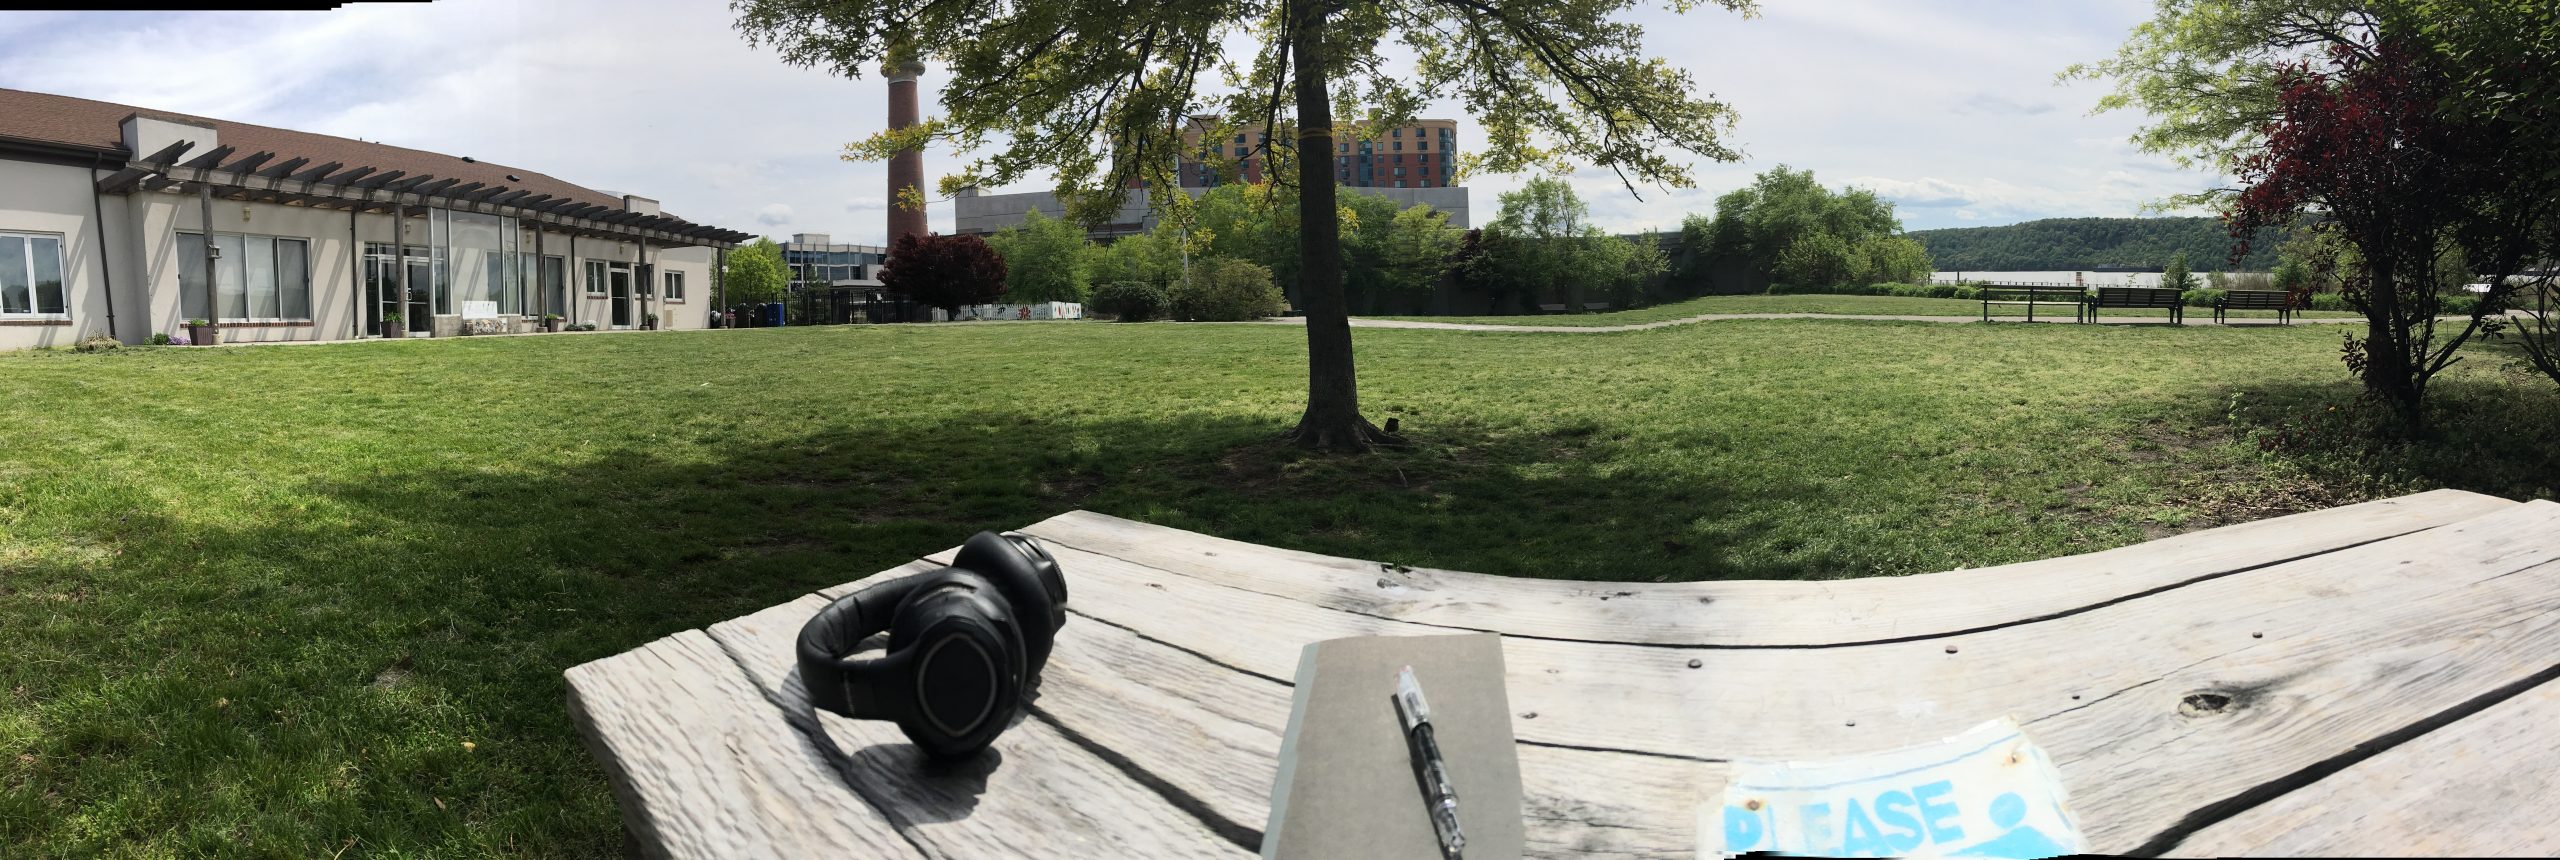
No. There was nothing keeping me at my desk but my own mind. So, I turned off my laptop, grabbed my notebook, pen, phone, headphones, sunglasses, and keys, then walked out the door.
I’ve gotten more outlining done and more clarity about what I need to do for the next few weeks in the past hour and a half at a dirty picnic table in the park down the street from my apartment than I have in the last two days at my desk.

Giving myself permission to step away from my desk over the past two months has been wonderful. My fears of missing something were unfounded. I’m able to take a phone calls with minimal distractions and I’m still able to answer questions on Slack from my coworkers. The biggest step I took in that direction was setting the expectation of not being constantly online, but checking in every few hours instead. I’m still reachable if something is urgent, otherwise I get up to speed and weigh in every few hours.
Time
Realizing that work doesn’t have to be done solely during the traditional 9-5 schedule has been crucial for me, too. This statement actually has two parts:
- Working outside of traditional hours is okay.
- Not working during traditional business hours is okay, too.
Before this job, I understood #1, but I never gave myself permission to not work during business hours.
The most important thing is that a task gets done by its deadline, not that it gets done between 9-5.
If getting up early, working for an hour or two, then making breakfast and reading or walking for an hour allows you to stay focused for the rest of the day, do it.
If going home at 4pm and doing those invoices after dinner will reduce your stress levels, do it.
If staying offline for a few hours reduces distractions and allows you to get important work done, do it.
If researching new tech platforms is easier with a cocktail after 10pm, pour a drink and do it after 10pm.
If taking off Friday to spend the day with visiting friends and completing your tasks on Sunday after they leave works best for you this week, great!
Do what you need to do in order to get your work done in the best way possible. Everything else is secondary.
What assumptions are you making about how your work must be done? Question them. Try breaking those assumptions and see what happens. The downside might be smaller than you think. The upside is a better life.