
Arenât familiar with Sol LeWitt or his art? Read this.
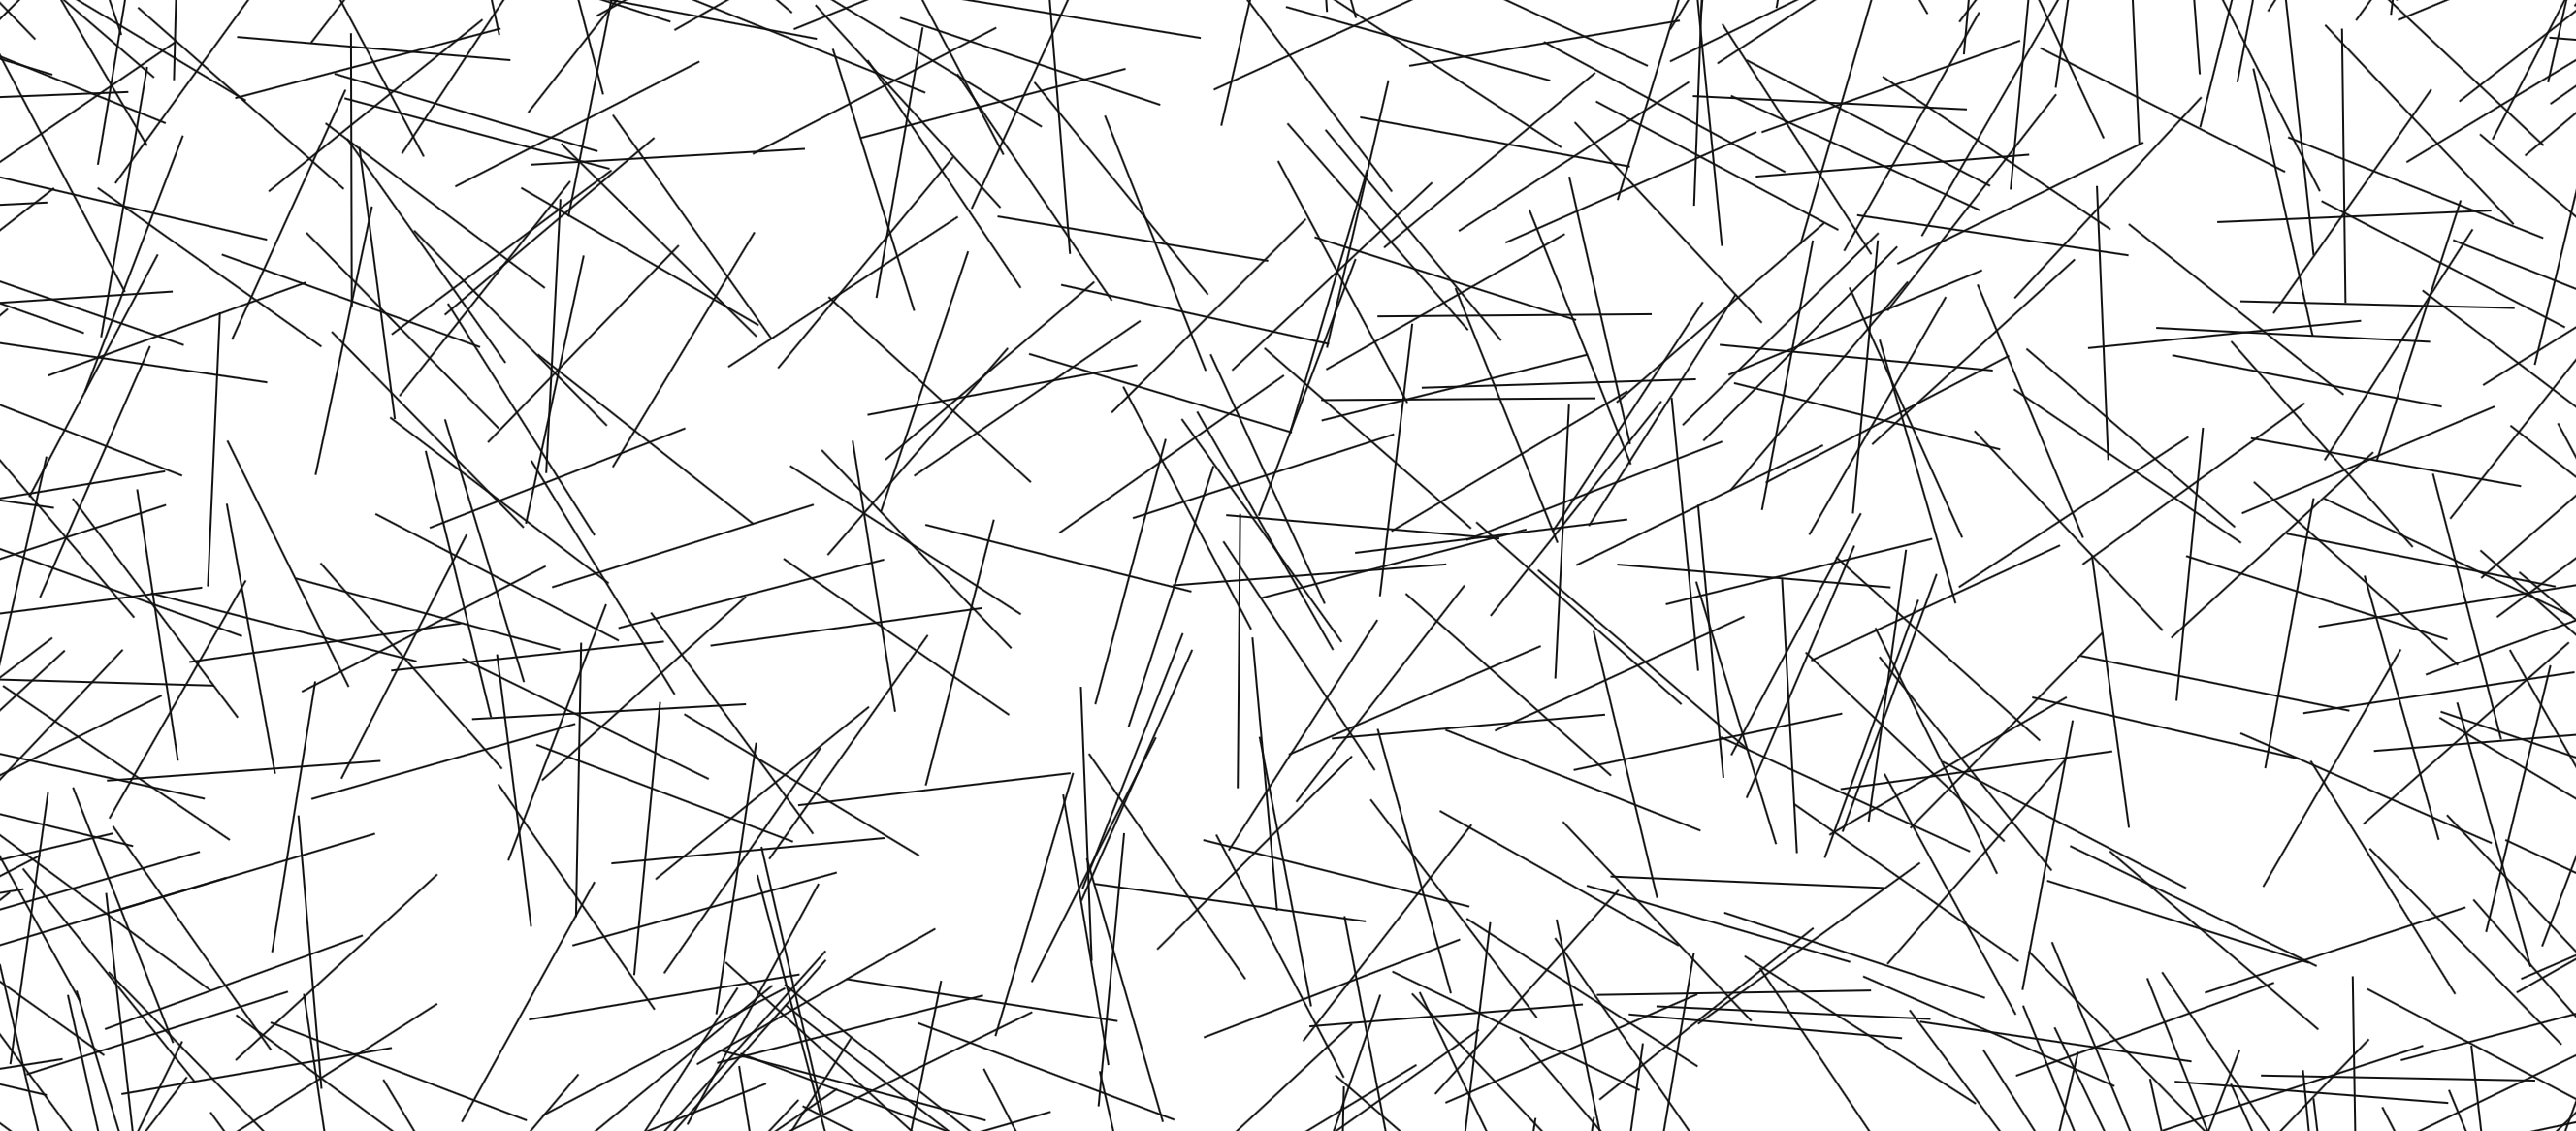
Wall Drawing 86: Ten thousand lines about 10 inches (25 cm) long, covering the wall evenly.
Here is a gfycat preview:
Open my D3 implementation of Wall Drawing 86 in a new window â
It is also available as a block.
Design Details
- LeWittâs instructions dictate 10,000 10-inch lines on a wall. Since computer screens are much smaller, I chose 1,000 lines that are roughly 141 pixels long (
100*sqrt(2)). - I chose to conform this to the size of the viewerâs window and have each display randomly generated, so each viewer will have a unique experience.
- Just as the size of the wall this piece was implemented on determined the density of the lines, the size of the window will determine the density. You can try out different densities by resizing the screen. The illustration will rebuild after you resize the window.
- LeWittâs instructions indicate that the wall should be evenly covered. Due to randomly generating the starting and ending values of the points, I couldnât figure out a way to have even distribution without having some lines go outside of the edges of the window. If I kept every point inside the window, a space around the edges emerges where the lines are not as evenly distributed. I decided it was better to have lines going over the edge than an uneven distribution.
Technical Details
Making equal length line segments
Making equal length line segments turned out to be a little more difficult than I anticipated. Lines are drawn by picking two sets of (x,y) coordinates and connecting them. If you leave this 100% random, youâll get lines of all different lengths and slopes. If you want lines of equal lengths and different slopes, however, you need to be a little more crafty.
I came up with two ways of doing it: 1) Pick a random slope and fixed length, then solve a series of rearranged quadratic equations derived from the point-slope form of a line and the distance formulaArchived Link. 2) Derive the second set of coordinates based off of a fixed formula with the first coordinates. This will result in lines having all the same slope initially. Then apply a transform to rotate the lines about their midpoints by a random angle.
Number two was faster and simpler for me to implement, so I went that route.
The underlying data set
So much of implementing these drawings with D3.js rely on making a solid, usable data set to join elements with. (After all, D3 stands for data-driven-documents.) Creating these data sets is where I spend most of my time. Once Iâve created them, everything else follows pretty quickly. Here is the function I wrote to create the underlying data set on this piece:
function lineData() { function getRandomArbitrary(min, max) { return Math.random() * (max - min) + min; } var data = new Array(); var id = 1; var ww = window.innerWidth; // Width of the window viewing area var wh = window.innerHeight; // Height of the window viewing area // iterate for cells/columns inside rows for (var line = 0; line 1000; line++) { // 1000 lines var x1 = getRandomArbitrary(-100, ww); // initial points can start 100px off the screen to make even distribution work var y1 = getRandomArbitrary(-100, wh); data.push({ id: id, // For identification and debugging x1: x1, y1: y1, x2: x1 + 100, // Move 100 to the right y2: y1 + 100, // Move 100 up rotate: getRandomArbitrary(0, 360) // Pick a random angle between 0 and 360 }) id++; // Increment the ID } return data; } Rotation
To make the rotation work without affecting the even distribution of the lines, I needed to rotate them around their midpoints. Otherwise theyâd be rotated around (0,0), which puts lines out of the viewing area at large angles. I essentially used the midpoint formula to calculate the midpoints. I simplified since I know the length of each line. Here is the tranform attribute I applied:
.attr("transform", function(d) { return "rotate(" + d.rotate + " " + (d.x1 + 50) + " " + (d.y1 + 50) + ")";})Transition
I handled the transition by first defining the lines as starting and ending at the same set of coordinates, then doing a delayed transition to their real end points. I applied the rotation before the transition so that the lines would appear to grow, but not rotate. To create the effect of the lines being drawn one by one in real-time, I added a delay function with an index. With a 20 millisecond delay and 1000 lines, it takes about 20 seconds to complete:
var line = svg.selectAll("line") .data(lineData) .enter().append('line') .attr("id", function(d) { return d.id; }) .attr("x1", function(d) { return d.x1; }) .attr("y1", function(d) { return d.y1; }) .attr("transform", function(d) { return "rotate(" + d.rotate + " " + (d.x1 + 50) + " " + (d.y1 + 50) + ")";}) .attr("x2", function(d) { return d.x1; }) .attr("y2", function(d) { return d.y1; }).transition().delay(function(d,i){ return 20*i; }).duration(750) .attr("x2", function(d) { return d.x2; }) .attr("y2", function(d) { return d.y2; });Want to dig in a little further? Check out my implementation and view source. All of the specs are there.
Tools Used
- D3.js – The D3.js library is well-suited to Sol LeWittâs early works. D3âs foundational principle of joining data to elements is easy to apply to LeWittâs symmetrical objects.
- jQuery – Iâm using jQuery to detect changes in the window size and trigger removing & rebuilding the visualization.
Inspiration and References
- Wall Drawing 86 at MASSMoCA
- Pages 142-143 in Sol LeWitt: 100 Views
Detail shot of the version on display at MASSMoCA: 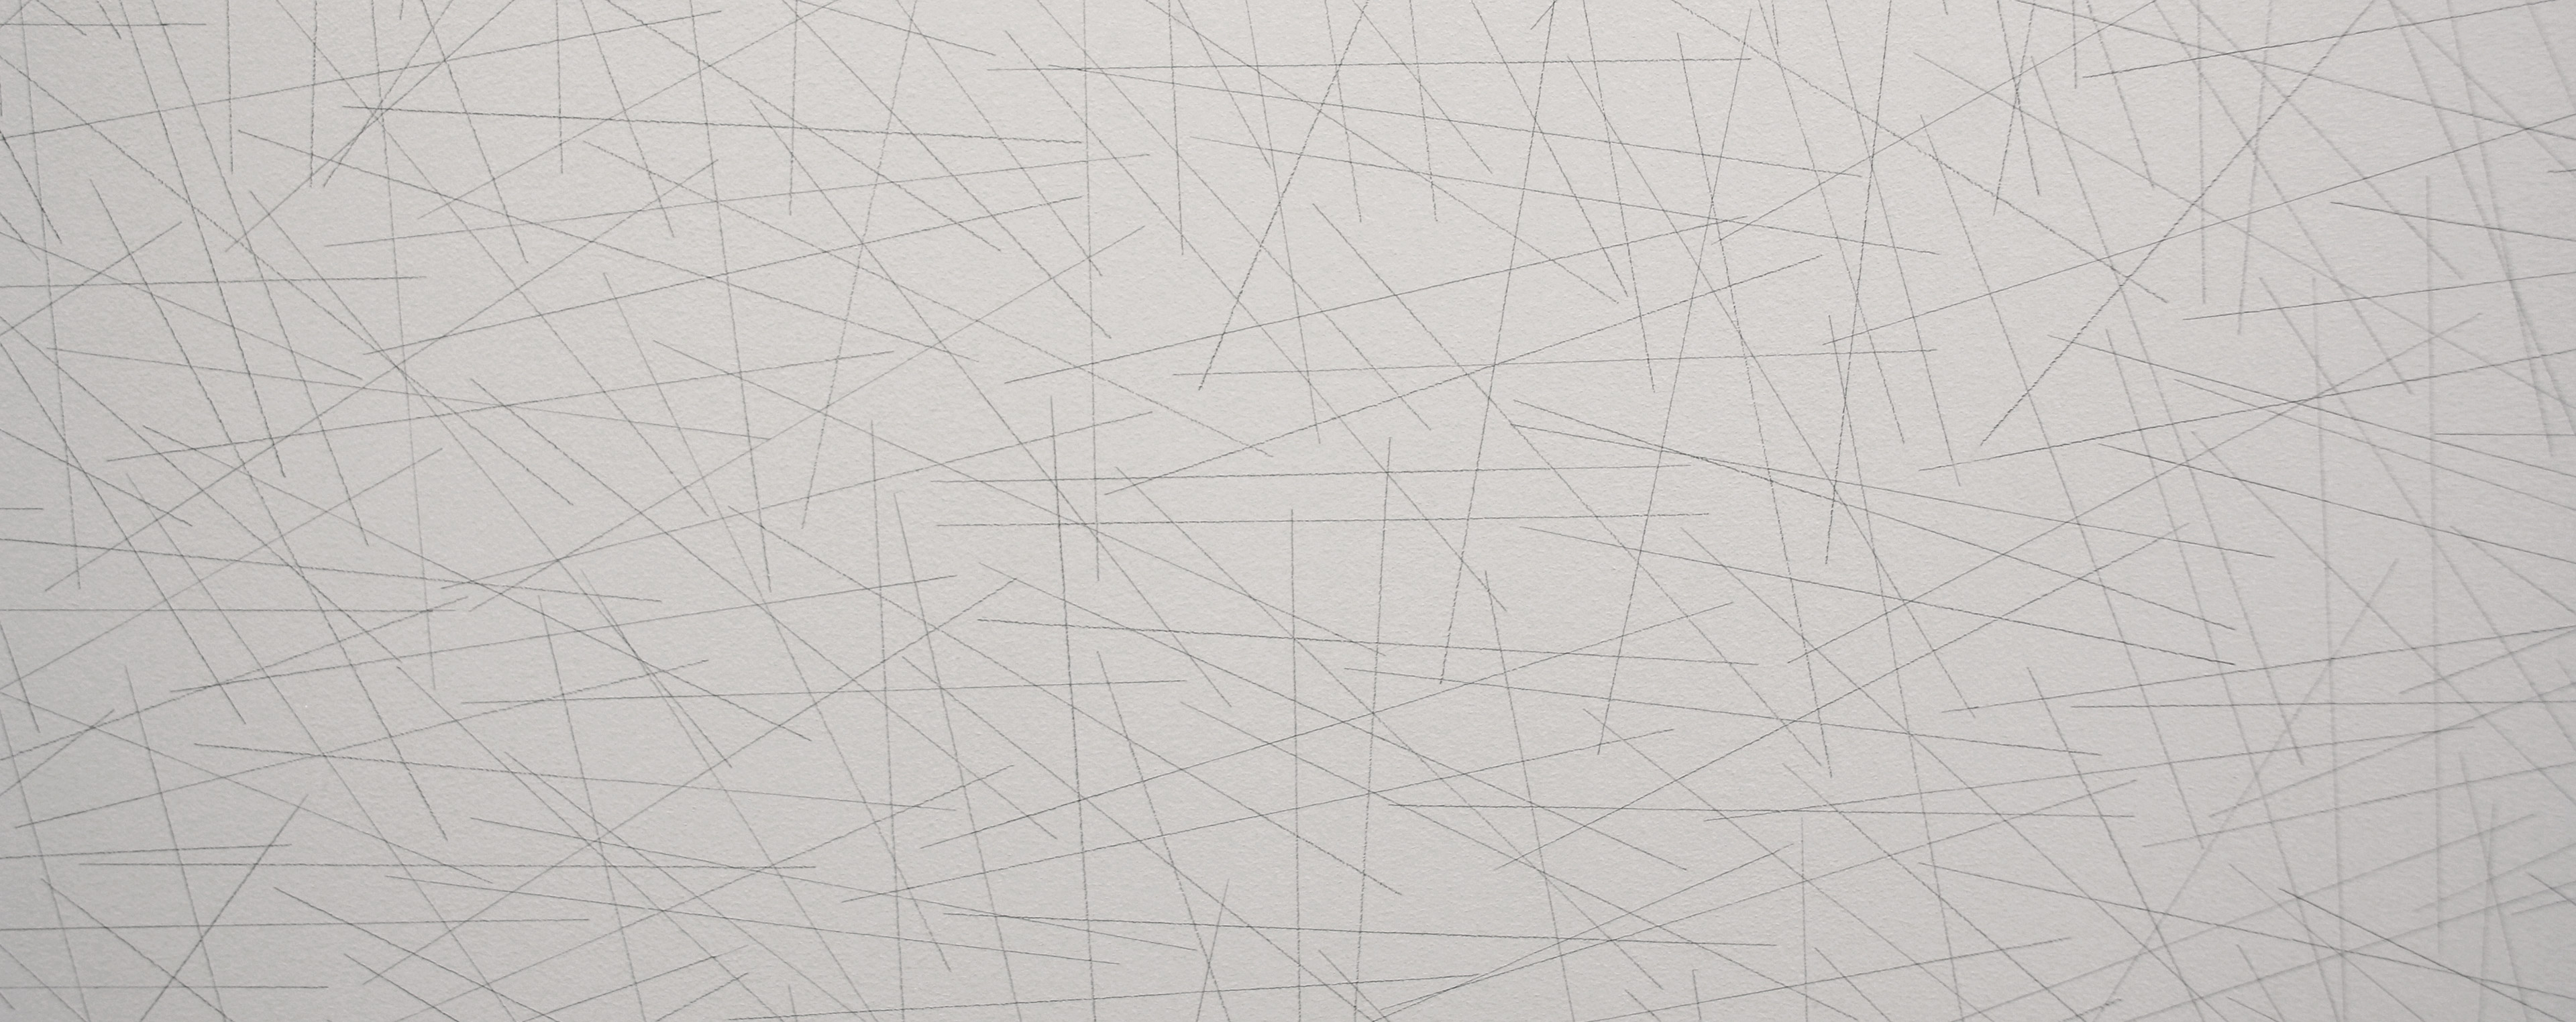
Leave a Reply