Archives

Category: Sol-LeWitt

  • Sol LeWitt’s Wall Drawings 852 and 853 with D3.js


    Aren’t familiar with Sol LeWitt or his art? Read this.

    I had an insight while going through the D3.js documentation to find a solution to another piece: d3.area() with a highly curved fit line isn’t that different from wall drawings 852 and 853! By the way, 852 and 853 are actually distinct pieces, though they are often grouped together into one display like the one at MASSMoCA. I worked on the solution to 852 first, then modified it to make 853:

    Wall Drawing 852: A wall divided from the upper left to the lower right by a curvy line; left: glossy yellow; right: glossy purple.

    Wall Drawing 853: A wall bordered and divided vertically into two parts by a flat black band. Left part: a square is divided vertically by a curvy line. Left: glossy red; right: glossy green; Right part: a square is divided horizontally by a curvy line. Top: glossy blue; bottom: glossy orange.

    Here are previews of 852 and 853 respectively:

    Open my D3 implementation of Wall Drawing 852 in a new window →

    Open my D3 implementation of Wall Drawing 853 in a new window →

    They are also available as blocks: 852 853

    The underlying data set

    So much of implementing these drawings with D3.js rely on making a solid, usable data set to join elements with. (After all, D3 stands for data-driven-documents.) Creating these data sets is where I spend most of my time. Once I’ve created them, everything else follows pretty quickly.

    Since d3.area() makes an area graph with given points, I had to create a data set of points. I wanted the start and end points to be defined with random (but constrained) points in the middle. Here is what I came up with for 852:

    var	ww = window.innerWidth, 	wh = window.innerHeight;  function getRandomArbitrary(min, max) {   return Math.random() * (max - min) + min; }  function lineData() { 	var data = new Array(); 		for (var point = 0; point < 5; point++) { 			var x = getRandomArbitrary(ww/10, ww-ww/10); // Constrains within the middle 80% 			var y = getRandomArbitrary(wh/10, wh-wh/10);		 				data.push({ 				x: x, 				y: y 			}) 		} 		// Starting point upper left 		data.push({ 			x: 0, 			y: 0 		}); 		// End point lower right 		data.push({ 			x: ww, 			y: wh 		}) 	 	return data; }

    For 853, things were a little trickier since the left is oriented vertically:

    var ww = window.innerWidth, 	wh = window.innerHeight - 80, 	halfwidth = ww/2 - 60;	  function getRandomArbitrary(min, max) {   return Math.random() * (max - min) + min; }  function fillLeft() { 	var data = new Array(); 		for (var point = 0; point < 3; point++) { 			var x = getRandomArbitrary(halfwidth/10, halfwidth-halfwidth/10); // Keeps within the middle 80% 			var y = getRandomArbitrary(wh/10, wh-wh/10);		 				data.push({ 				x: x, 				y: y 			}) 		} 		data.push({ 			x: halfwidth/2, 			y: 0 		}); 		data.push({ 			x: halfwidth/2, 			y: wh 		}) 	 	return data; }   function fillRight() { 	var data = new Array(); 		for (var point = 0; point < 3; point++) { 			var x = getRandomArbitrary(halfwidth/10, halfwidth-halfwidth/10); // Keeps within the middle 80% 			var y = getRandomArbitrary(wh/10, wh-wh/10);		 				data.push({ 				x: x, 				y: y 			}) 		} 		data.push({ 			x: 0, 			y: wh/2 		}); 		data.push({ 			x: halfwidth, 			y: wh/2 		}) 	 	return data; } 

    d3.area()

    One of the most important things to note about d3.area() is that you must sort your data sets (by x if the chart is horizonal, y if vertical) before passing them to the function. Otherwise you end up with something like this because the values are out of order:

    Out of order values!

    D3 has selection.sort() built in, but you also need to pass a function telling it how to sort:

    .sort(function(a,b) { return +a.x - +b.x; }) // Sorting by x ascending .sort(function(a,b) { return +a.y - +b.y; }) // Sorting by y ascending

    Most area charts tend to be horizontal, and nearly all examples you can find are structured in this way. You need to pass .x, .y0, and .y1:

    var area = d3.area()     .x(function(d) { return d.x; })     .y0(window.innerHeight)     .y1(function(d) { return d.y; })     .curve(d3.curveBasis);

    If you are switching to a vertical orientation, you instead need to pass .y, .x0, and .x1:

    var areaLeft = d3.area() 	.x0(0)     .x1(function(d) { return d.x; })     .y(function(d) { return d.y; })     .curve(d3.curveBasis);

    Curves and Points

    I played with a number of curve functions and a number of points to see how they compared to traditional interpretations of Sol LeWitt’s pieces:

    • curveCatmullRom
    • curveCardinal
    • curveBasis
    • curveNatural
    • curveLinear

    I eventually settled on curveBasis for both pieces. It creates the smoothest curving line with the given random points, which produces results similar to the curved lines in Sol’s earlier work. curveCatmullRom was my second choice, but occasionally produced harsh concave regions.

    For the larger standalone piece (852) I used 7 total points, including the end points. For 853, which consists of two different curves, I used 5 points each since the widths were smaller.

    Rebuilding on screen resize

    When you resize the screen, the divs gets destroyed and then rebuilt based on the new screen size. Here is the function I use to handle that. It is the same thing I used on 86 and on my Jekyll posts heatmap calendar. I wrapped the D3 instructions in its own function, called that function on first load, then wrote a function to destroy the node divs when the screen is resized and reexecute the D3 instructions after the screen resize ends. I’m sure it can be done with regular javascript, but jQuery makes this kind of thing fast and easy:

    // run on first load sol852();  $(window).resize(function() {     if(this.resizeTO) clearTimeout(this.resizeTO);     this.resizeTO = setTimeout(function() {         $(this).trigger('resizeEnd');     }, 500); });  //resize on resizeEnd function $(window).bind('resizeEnd', function() { 	 d3.selectAll("div.node").remove(); 	 sol852(); });

    Tools Used

    • D3.js – The D3.js library is well-suited to Sol LeWitt’s works. D3’s foundational principle of joining data to elements is easy to apply to LeWitt’s drawings.
    • jQuery – I’m using jQuery to detect changes in the window size and trigger removing & rebuilding the visualization.

    Inspiration and References

    Detail shot of the version on display at MASSMoCA:

    Detail shot of the version on display at MASSMoCA:

  • Make Your Own Sol LeWitt 614!
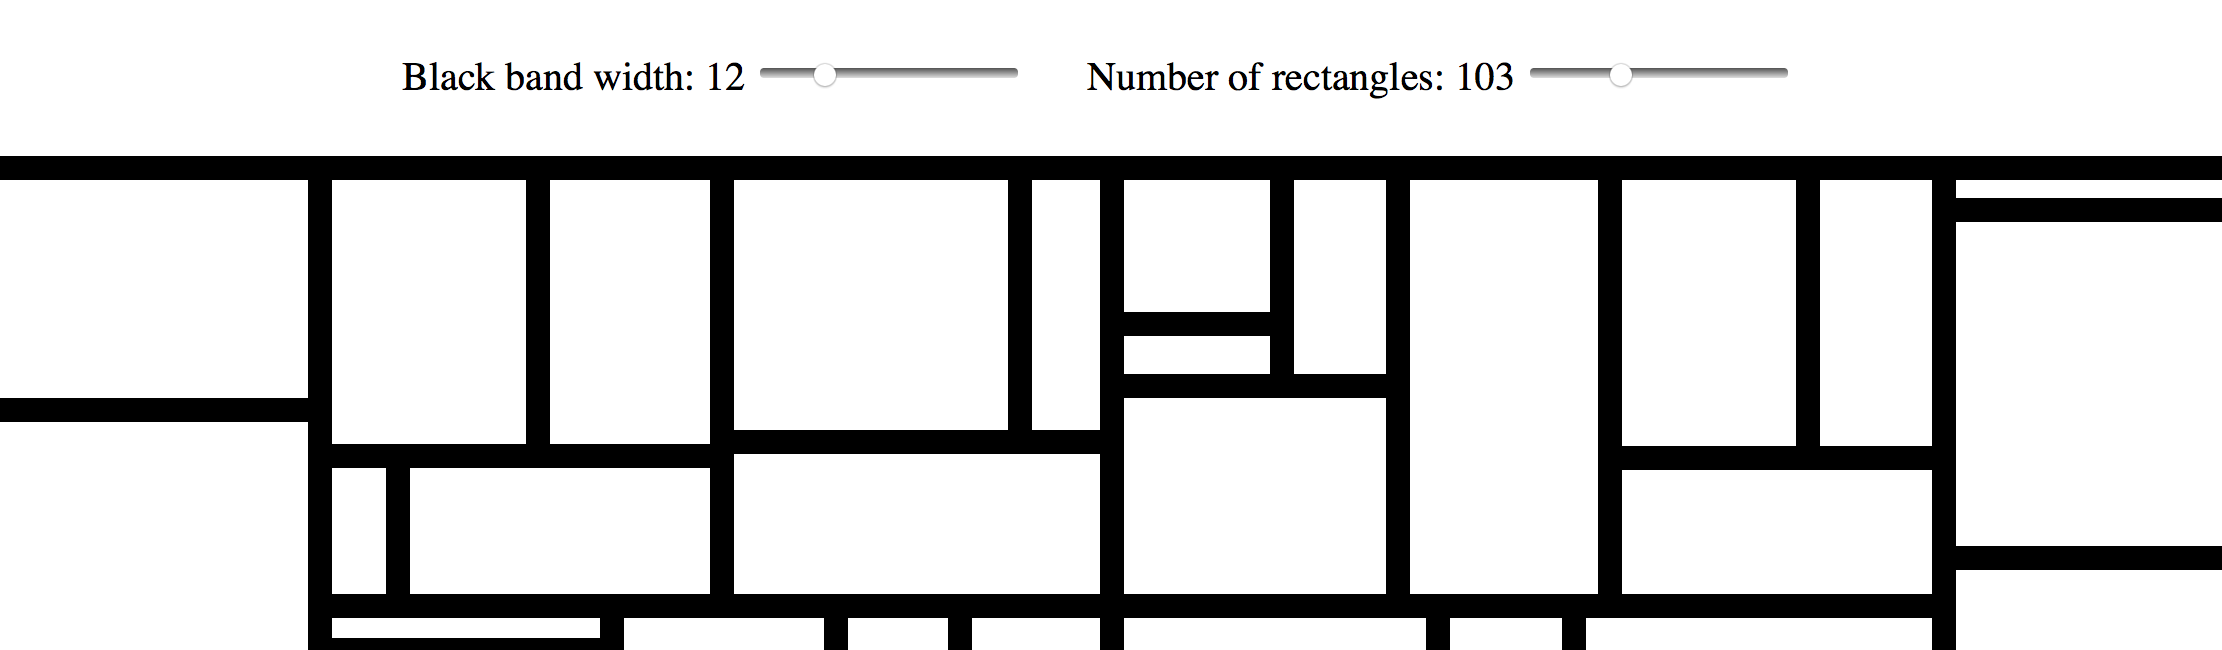

    It is also available as a block.

    Background

    Here are Sol’s original instructions for Wall Drawing 614:

    Wall Drawing 614: Rectangles formed by 3-inch (8 cm) wide India ink bands, meeting at right angles.

    Technical Details

    For the technical details of making the drawing itself, check out my post on it. This post focuses on rebuilding the tool based on user input.

    The Inputs

    I used a form, a range input, an output, and some in-line JavaScript to power the sliders and display their values in real-time:

    Black band width: type="range" name="paddingInput" id="paddingInputId" value="15" min="1" max="50" oninput="paddingOutputId.value = paddingInputId.value"> name="paddingOutput" id="paddingOutputId">15px /> Number of rectangles: type="range" name="rectInput" id="rectInputId" value="40" min="5" max="300" oninput="rectOutputId.value = rectInputId.value"> name="rectOutput" id="rectOutputId">40

    Live example:

    Black band width: 15px
    Number of rectangles: 40

    Basing my functions on the values of the inputs

    A set a variable to the element I wanted to access, then I called the .value of that element in my functions. (See the post on 614 for more info about these functions.)

    var padding = document.getElementById("paddingInputId"); var rectNumber = document.getElementById("rectInputId");  function treeData() {   var obj = {name: "rect"};   var children = [];   for (var row = 0; row < rectNumber.value; row++) {     children.push({id: row, value: getRandomArbitrary(60, 1000)})   }   obj['children'] = children;   return obj; }  var treemap = d3.treemap()     .size([width, height])     .padding(padding.value)     .round(true)     .tile(d3.treemapBinary);

    Rebuilding after inputs are changed

    Similar to rebuilding on screen resize in the original version, I detect when there is a change in one of the inputs and then call a function to remove the divs and rebuild the treemap based on the inputs. jQuery makes this kind of thing fast and easy:

    $( "#paddingInputId" ).change(function() {   	d3.selectAll("div.node").remove(); 	sol614(); });  $( "#rectInputId" ).change(function() {   	d3.selectAll("div.node").remove(); 	sol614(); });

    Want to dig in a little further? Check out my implementation and view source. All of the specs are there.

    Tools Used

    • D3.js – The D3.js library is well-suited to Sol LeWitt’s works. D3’s foundational principle of joining data to elements is easy to apply to LeWitt’s drawings.
    • jQuery – I’m using jQuery to detect changes in the window size and trigger removing & rebuilding the visualization.
  • Sol LeWitt’s Wall Drawing 614 with D3.js Treemap and Randomization


    Aren’t familiar with Sol LeWitt or his art? Read this.

    Wall Drawing 614: Rectangles formed by 3-inch (8 cm) wide India ink bands, meeting at right angles.

    Here is a preview:

    Open my D3 implementation of Wall Drawing 614 in a new window →

    It is also available as a block.

    Design Details

    • LeWitt’s instructions are pretty open. The drafter can choose the number of rectangles. I chose 40.
    • Since screens work in pixels instead of inches, I chose to make the bands 15px wide. I tried various configurations and I think 15px
    • I chose to conform this to the size of the viewer’s window and have each display randomly generated, so each viewer will have a unique experience.
    • Just as the size of the wall this piece was implemented on determined the density of the lines, the size of the window will determine the density. You can try out different densities by resizing the screen. The illustration will rebuild after you resize the window.
    • If you like this, I also made a version that you can customize.

    Technical Details

    • The placement and size of the rectangles are handled by d3.treemap().
    • I tried a few different tiling methods and decided to use d3.treemapBinary. I liked the look of it the best.
    • Each viewer gets a unique experience because the size of each rectangle is set at random on each page load.

    The underlying data set

    So much of implementing these drawings with D3.js rely on making a solid, usable data set to join elements with. (After all, D3 stands for data-driven-documents.) Creating these data sets is where I spend most of my time. Once I’ve created them, everything else follows pretty quickly. Here is the function that creates the underlying data set on this piece. I owe major props to Eric Davis on helping me figure this out. I was getting close, but nothing I made was accepted by treemap(). He helped me identify my issues, which included making this data set and then passing it to d3.hierarchy before passing it to treemap.

    function getRandomArbitrary(min, max) { 	  return Math.random() * (max - min) + min; }  function treeData() {   var obj = {name: "rect"};   var children = [];   for (var row = 0; row < 40; row++) {     children.push({id: row, value: getRandomArbitrary(60, 1000)})   }   obj['children'] = children;   return obj; }

    Working with treemap

    One of the difficulties of D3.js transitioning from v3 to v4 recently is that most of the tutorials you can find on the web no longer work. Thankfully Mike Bostock created a great example of a treemap with v4 that I referenced quite a bit.

    After a few passes through the documentation and a call on my friend Eric Davis, we figured out how to pass data to d3.treemap():

    1. Create a data set that has a clear parent-child structure with unique parents
    2. Pass this to d3.hierarchy
    3. Call .sum() on d3.hierarchy and sum the values before passing it to treemap
    4. Pass it to treemap

    See below:

    var width = window.innerWidth + 30, 	height = window.innerHeight + 30; var format = d3.format(",d");  var treemap = d3.treemap()     .size([width, height])     .padding(15)     .round(true)     .tile(d3.treemapBinary);  var tree = d3.hierarchy(tree);  tree.sum(function(d) { return d.value; }); // always log for debugging! console.log(tree);  treemap(tree);  d3.select("body") 	.selectAll(".node") 	.data(tree.leaves()) 	.enter().append("div") 	  .attr("class", "node") 	  .attr("title", function(d) { return d.data.id; }) 	  .style("left", function(d) { return d.x0 + "px"; }) 	  .style("top", function(d) { return d.y0 + "px"; }) 	  .style("width", function(d) { return d.x1 - d.x0 + "px"; }) 	  .style("height", function(d) { return d.y1 - d.y0 + "px"; }) 	  .style("background", "#fff");

    Rebuilding on screen resize

    When you resize the screen, the divs gets destroyed and then rebuilt based on the new screen size. Here is the function I use to handle that. It is the same thing I used on 86 and on my Jekyll posts heatmap calendar. I wrapped the D3 instructions in its own function, called that function on first load, then wrote a function to destroy the node divs when the screen is resized and reexecute the D3 instructions after the screen resize ends. I’m sure it can be done with regular javascript, but jQuery makes this kind of thing fast and easy:

    // run on first load sol614();  $(window).resize(function() {     if(this.resizeTO) clearTimeout(this.resizeTO);     this.resizeTO = setTimeout(function() {         $(this).trigger('resizeEnd');     }, 500); });  //resize on resizeEnd function $(window).bind('resizeEnd', function() { 	 d3.selectAll("div.node").remove(); 	 sol614(); });

    Want to dig in a little further? Check out my implementation and view source. All of the specs are there.

    Tools Used

    • D3.js – The D3.js library is well-suited to Sol LeWitt’s works. D3’s foundational principle of joining data to elements is easy to apply to LeWitt’s drawings.
    • jQuery – I’m using jQuery to detect changes in the window size and trigger removing & rebuilding the visualization.

    Inspiration and References

    Detail shot of the version on display at MASSMoCA:

    Detail shot of the version on display at MASSMoCA:

    Another shot of the version on display at MASSMoCA:

    Detail shot of the version on display at MASSMoCA:

    If you like this, I also made a version that you can customize. Check it out.

  • Sol LeWitt’s Wall Drawing 289 with D3.js Transitions


    Aren’t familiar with Sol LeWitt or his art? Read this.

    Wall Drawing 289: A 6-inch (15 cm) grid covering each of the four black walls. White lines to points on the grids. Fourth wall: twenty-four lines from the center, twelve lines from the midpoint of each of the sides, twelve lines from each corner. (The length of the lines and their placement are determined by the drafter.)

    Here is a gfycat preview:

    Open my D3 implementation of Wall Drawing 289 in a new window →

    It is also available as a block.

    Design Details

    • LeWitt’s instructions dictate that the lines are to go to a point on a 6-inch grid. I didn’t lay out a grid first, but I did round the random line ending points to they land on whole numbers.
    • I chose to conform this to the size of the viewer’s window and have each display randomly generated, so each viewer will have a unique experience.
    • Just as the size of the wall this piece was implemented on determined the density of the lines, the size of the window will determine the density. You can try out different densities by resizing the screen. The illustration will rebuild after you resize the window.
    • I tried drawing each line individually in time like I did with number 86, but it looked so much cooler with all lines coming in at one from their starting points. The viewer gets the understanding of where each line starts and the randomly-generated end points fulfill the requirement of the length and location of the lines being determined by the drafter.

    Technical Details

    • The midpoints are determined by the size of the window.
    • Each viewer gets a unique experience because the length of the lines is set at random on each page load.

    The underlying data set

    So much of implementing these drawings with D3.js rely on making a solid, usable data set to join elements with. (After all, D3 stands for data-driven-documents.) Creating these data sets is where I spend most of my time. Once I’ve created them, everything else follows pretty quickly. Here is the function I wrote to create the underlying data set on this piece:

    function getRandomArbitrary(min, max) {   return Math.round(Math.random() * (max - min) + min); }  function lineData() { 	var data = new Array(); 	var id = 1;	 	var ww = window.innerWidth; 	var wh = window.innerHeight; 	var numLines = 12; 	// iterate for cells/columns inside rows 		for (var center = 0; center < numLines * 2; center++) {	 				data.push({ 				id: id, 				class: "center", 				x1: ww/2, 				y1: wh/2, 				x2: getRandomArbitrary(0, ww), 				y2: getRandomArbitrary(0, wh) 			}) 			id++; 		} 				 		for (var topleft = 0; topleft < numLines; topleft++) {	 				data.push({ 				id: id, 				class: "topleft", 				x1: 0, 				y1: 0, 				x2: getRandomArbitrary(0, ww), 				y2: getRandomArbitrary(0, wh) 			}) 			id++; 		}  		for (var topright = 0; topright < numLines; topright++) {	 				data.push({ 				id: id, 				class: "topright", 				x1: ww, 				y1: 0, 				x2: getRandomArbitrary(0, ww), 				y2: getRandomArbitrary(0, wh) 			}) 			id++; 		}  		for (var bottomright = 0; bottomright < numLines; bottomright++) {		 				data.push({ 				id: id, 				class: "bottomright", 				x1: ww, 				y1: wh, 				x2: getRandomArbitrary(0, ww), 				y2: getRandomArbitrary(0, wh) 			}) 			id++; 		}  		for (var bottomleft = 0; bottomleft < numLines; bottomleft++) {		 				data.push({ 				id: id, 				class: "bottomleft", 				x1: 0, 				y1: wh, 				x2: getRandomArbitrary(0, ww), 				y2: getRandomArbitrary(0, wh) 			}) 			id++; 		}  		for (var middleleft = 0; middleleft < numLines; middleleft++) {		 				data.push({ 				id: id, 				class: "middleleft", 				x1: 0, 				y1: wh/2, 				x2: getRandomArbitrary(0, ww), 				y2: getRandomArbitrary(0, wh) 			}) 			id++; 		}  		for (var middleright = 0; middleright < numLines; middleright++) {		 				data.push({ 				id: id, 				class: "middleright", 				x1: ww, 				y1: wh/2, 				x2: getRandomArbitrary(0, ww), 				y2: getRandomArbitrary(0, wh) 			}) 			id++; 		}   		for (var middletop = 0; middletop < numLines; middletop++) {		 				data.push({ 				id: id, 				class: "middletop", 				x1: ww/2, 				y1: 0, 				x2: getRandomArbitrary(0, ww), 				y2: getRandomArbitrary(0, wh) 			}) 			id++; 		}  		for (var middlebottom = 0; middlebottom < numLines; middlebottom++) {		 				data.push({ 				id: id, 				class: "middlebottom", 				x1: ww/2, 				y1: wh, 				x2: getRandomArbitrary(0, ww), 				y2: getRandomArbitrary(0, wh) 			}) 			id++; 		} 	return data; } 

    Transition

    I handled the transition by first defining the lines as starting and ending at the same set of coordinates, then doing a delayed transition to their real end points:

    var line = svg.selectAll(".rand") 	.data(lineData) 	.enter().append('line') 	.attr("class", function(d) { return d.class; }) 	.attr("id", function(d) { return d.id; }) 	.attr("x1", function(d) { return d.x1; } ) 	.attr("y1", function(d) { return d.y1; }) 	.attr("x2", function(d) { return d.x1; } ) 	.attr("y2", function(d) { return d.y1; }).transition().duration(3000) 	.attr("x2", function(d) { return d.x2; }) 	.attr("y2", function(d) { return d.y2; });

    Rebuilding on screen resize

    When you resize the screen, the svg gets destroyed and then rebuilt based on the new screen size. New midpoints are calculated and new ending points for each other lines are calculated. Here is the function I use to handle that. It is the same thing I used on 86 and on my Jekyll posts heatmap calendar. I wrapped the D3 instructions in its own function, called that function on first load, then wrote a function to destroy the svg when the screen is resized and reexecute the D3 instructions after the screen resize ends. I’m sure it can be done with regular javascript, but jQuery makes this kind of thing fast and easy:

    // run on first load sol289();  $(window).resize(function() {     if(this.resizeTO) clearTimeout(this.resizeTO);     this.resizeTO = setTimeout(function() {         $(this).trigger('resizeEnd');     }, 500); });  //resize on resizeEnd function $(window).bind('resizeEnd', function() { 	 d3.selectAll("svg").remove(); 	 sol289(); });

    Want to dig in a little further? Check out my implementation and view source. All of the specs are there.

    Tools Used

    • D3.js – The D3.js library is well-suited to Sol LeWitt’s early works. D3’s foundational principle of joining data to elements is easy to apply to LeWitt’s symmetrical objects.
    • jQuery – I’m using jQuery to detect changes in the window size and trigger removing & rebuilding the visualization.

    Inspiration and References

    Detail shot of the version on display at MASSMoCA: Detail shot of the version on display at MASSMoCA:

  • Sol LeWitt’s Wall Drawing 86 with D3.js Transitions
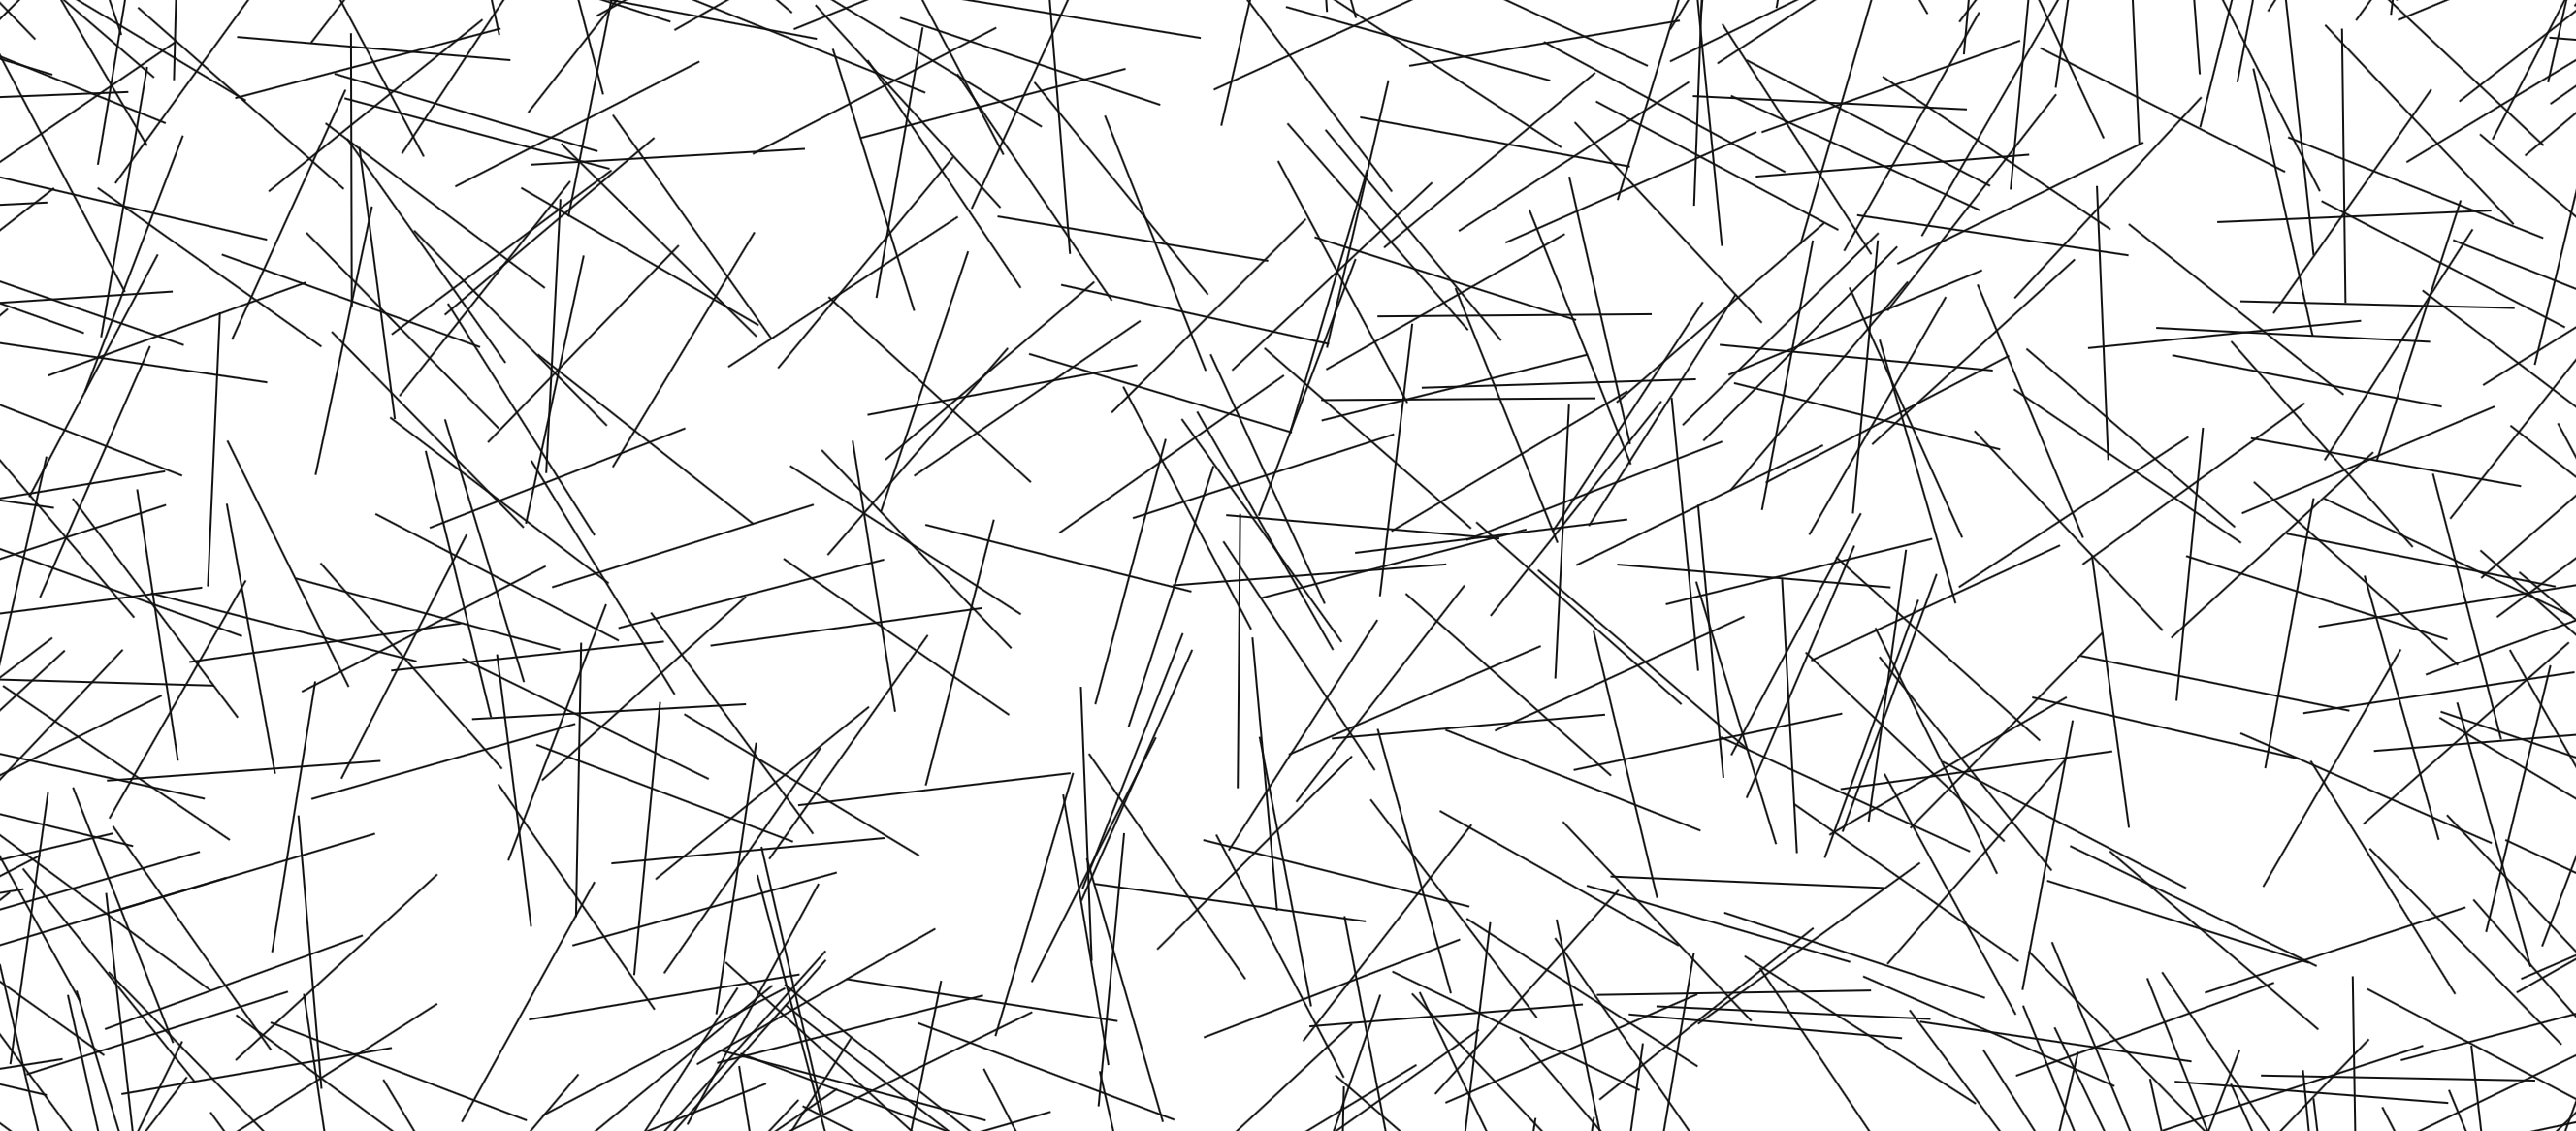

    Aren’t familiar with Sol LeWitt or his art? Read this.

    Wall Drawing 86: Ten thousand lines about 10 inches (25 cm) long, covering the wall evenly.

    Here is a gfycat preview:

    Open my D3 implementation of Wall Drawing 86 in a new window →

    It is also available as a block.

    Design Details

    • LeWitt’s instructions dictate 10,000 10-inch lines on a wall. Since computer screens are much smaller, I chose 1,000 lines that are roughly 141 pixels long (100*sqrt(2)).
    • I chose to conform this to the size of the viewer’s window and have each display randomly generated, so each viewer will have a unique experience.
    • Just as the size of the wall this piece was implemented on determined the density of the lines, the size of the window will determine the density. You can try out different densities by resizing the screen. The illustration will rebuild after you resize the window.
    • LeWitt’s instructions indicate that the wall should be evenly covered. Due to randomly generating the starting and ending values of the points, I couldn’t figure out a way to have even distribution without having some lines go outside of the edges of the window. If I kept every point inside the window, a space around the edges emerges where the lines are not as evenly distributed. I decided it was better to have lines going over the edge than an uneven distribution.

    Technical Details

    Making equal length line segments

    Making equal length line segments turned out to be a little more difficult than I anticipated. Lines are drawn by picking two sets of (x,y) coordinates and connecting them. If you leave this 100% random, you’ll get lines of all different lengths and slopes. If you want lines of equal lengths and different slopes, however, you need to be a little more crafty.

    I came up with two ways of doing it: 1) Pick a random slope and fixed length, then solve a series of rearranged quadratic equations derived from the point-slope form of a line and the distance formulaArchived Link. 2) Derive the second set of coordinates based off of a fixed formula with the first coordinates. This will result in lines having all the same slope initially. Then apply a transform to rotate the lines about their midpoints by a random angle.

    Number two was faster and simpler for me to implement, so I went that route.

    The underlying data set

    So much of implementing these drawings with D3.js rely on making a solid, usable data set to join elements with. (After all, D3 stands for data-driven-documents.) Creating these data sets is where I spend most of my time. Once I’ve created them, everything else follows pretty quickly. Here is the function I wrote to create the underlying data set on this piece:

    function lineData() { 	function getRandomArbitrary(min, max) { 	  return Math.random() * (max - min) + min; 	} 	var data = new Array(); 	var id = 1;	 	var ww = window.innerWidth; // Width of the window viewing area 	var wh = window.innerHeight; // Height of the window viewing area 	// iterate for cells/columns inside rows 		for (var line = 0; line  1000; line++) {  // 1000 lines 			var x1 = getRandomArbitrary(-100, ww); // initial points can start 100px off the screen to make even distribution work 			var y1 = getRandomArbitrary(-100, wh);		 				data.push({ 				id: id, // For identification and debugging 				x1: x1, 				y1: y1, 				x2: x1 + 100, // Move 100 to the right 				y2: y1 + 100, // Move 100 up 				rotate: getRandomArbitrary(0, 360) // Pick a random angle between 0 and 360 			}) 			id++; // Increment the ID 		} 	return data; } 

    Rotation

    To make the rotation work without affecting the even distribution of the lines, I needed to rotate them around their midpoints. Otherwise they’d be rotated around (0,0), which puts lines out of the viewing area at large angles. I essentially used the midpoint formula to calculate the midpoints. I simplified since I know the length of each line. Here is the tranform attribute I applied:

    .attr("transform", function(d) { return "rotate(" + d.rotate + " " + (d.x1 + 50) + " " + (d.y1 + 50) + ")";})

    Transition

    I handled the transition by first defining the lines as starting and ending at the same set of coordinates, then doing a delayed transition to their real end points. I applied the rotation before the transition so that the lines would appear to grow, but not rotate. To create the effect of the lines being drawn one by one in real-time, I added a delay function with an index. With a 20 millisecond delay and 1000 lines, it takes about 20 seconds to complete:

    var line = svg.selectAll("line") 	.data(lineData) 	.enter().append('line') 	.attr("id", function(d) { return d.id; }) 	.attr("x1", function(d) { return d.x1; }) 	.attr("y1", function(d) { return d.y1; }) 	.attr("transform", function(d) { return "rotate(" + d.rotate + " " + (d.x1 + 50) + " " + (d.y1 + 50) + ")";}) 	.attr("x2", function(d) { return d.x1; }) 	.attr("y2", function(d) { return d.y1; }).transition().delay(function(d,i){ return 20*i; }).duration(750) 	.attr("x2", function(d) { return d.x2; }) 	.attr("y2", function(d) { return d.y2; });

    Want to dig in a little further? Check out my implementation and view source. All of the specs are there.

    Tools Used

    • D3.js – The D3.js library is well-suited to Sol LeWitt’s early works. D3’s foundational principle of joining data to elements is easy to apply to LeWitt’s symmetrical objects.
    • jQuery – I’m using jQuery to detect changes in the window size and trigger removing & rebuilding the visualization.

    Inspiration and References

    Detail shot of the version on display at MASSMoCA: Detail shot of the version on display at MASSMoCA:

  • Sol LeWitt’s Wall Drawing 87 with D3.js Transitions


    Aren’t familiar with Sol LeWitt or his art? Read this.

    Wall Drawing 87: A square divided horizontally and vertically into four equal parts, each with lines and colors in four directions superimposed progressively.

    Since this is so close to 56 (which I’ve already done), I wanted to add an additional element to challenge myself and learn something: Transitions. The difference between the two is the separate color for each line direction, which ended up lending itself to transitions nicely.

    Adding the color and transitions into this one made me change my mental model for how I’m building these implementations. I was able to complete the first three I picked (56, 11, and 391) with only four elements inside the SVG: One for each quadrant. This is because I was able to make a single pattern for each quadrant (even though it appears that there are four sets lines are going in different directions) and have the patterns match up with the other quadrants. Textures.js doesn’t support making line-based patterns with more than one line color, so I needed to find a different approach.

    The solution turned out to solve my mental block for both the colors and the transitions. I started to doodle this drawing in a journal and realized that I did each line direction one whole layer at a time, layering each one on top of the others. Yet, I had been trying to cram all four directions into a single layer here on the web. So, I modified my D3 code to join more elements with different classes to the same underlying grid array to simulate the effect of layering the different colors.

    Then, I added a transition() and a delay() to each “layer” so that the viewer can also experience and take notice of the intentional layering of this piece.

    There is definitely more I can do with transitions. This is just the beginning for me. I achieved what I wanted with this piece, so I’m going to move on to others and continue exploring and learning how to implement transitions.

    Here is an image preview. Click on it to see the D3.js version:

    Open my D3 implementation of Wall Drawing 87 in a new window →

    It is also available as a block.

    Design Details

    • While any interpretation of Sol LeWitt’s instructions is technically valid as long as each statement is accounted for, I feel a responsibility to make my implementation beautiful, clean, and symmetrical.
    • When he says “four directions”, the common interpretation is 0 degrees, 90 degrees, 45 degrees, and 135 degrees.
    • On a wall, the dimensions are dictated by the physical size of the wall itself. On the web, since windows change size so easily and the proportions of the art are constant, I chose to define a fixed size for this piece.

    Color Palette

    Unlike the earlier colored versions that used grey, yellow, red, and blue, this uses Sol Lewitt’s second color palette of choice: grey, yellow, tan, and reddish-brown.

    Concord

    cmyk:
    44 36 33 1 1.00
    rgba:
    124 124 124 1.00
    hex:
    #7C7C7C

    Download color

    Sweet Corn

    cmyk:
    3 4 45 0 1.00
    rgba:
    254 238 136 1.00
    hex:
    #FEEE88

    Download color

    Jaffa

    cmyk:
    2 48 67 1 1.00
    rgba:
    222 123 74 1.00
    hex:
    #DE7B4A

    Download color

    Hawaiian Tan

    cmyk:
    7 56 96 19 1.00
    rgba:
    159 82 25 1.00
    hex:
    #9F5219

    Download color

    Tools Used

    • D3.js – The D3.js library is well-suited to Sol LeWitt’s early works. D3’s foundational principle of joining data to elements is easy to apply to LeWitt’s symmetrical objects.
    • Textures.js – I’m using this library to quickly create the background patterns. It plays very well with D3.js, which is why I chose it. It is a great little library that is very easy to use. It has some limitations around the edges, but the alternative is writing my own SVG paths for the patterns, which I didn’t want to do at this time.

    Technical Details

    • I repurposed some of the data-generating code for the squares from my Let’s Make a Grid with D3.js post.
    • One svg element with two groups and 8 rect elements in each group.
    • Basic transition() and delay() functions applied to animate the layers.
    • Want to dig in a little further? Check out my implementation and view source. All of the D3 specs are there.

    Inspiration and References

    Detail shot of the version on display at MASSMoCA: Detail shot of the version on display at MASSMoCA:

    Wide shot of the version on display at MASSMoCA (Poor lighting): Wide shot of the version on display at MASSMoCA:

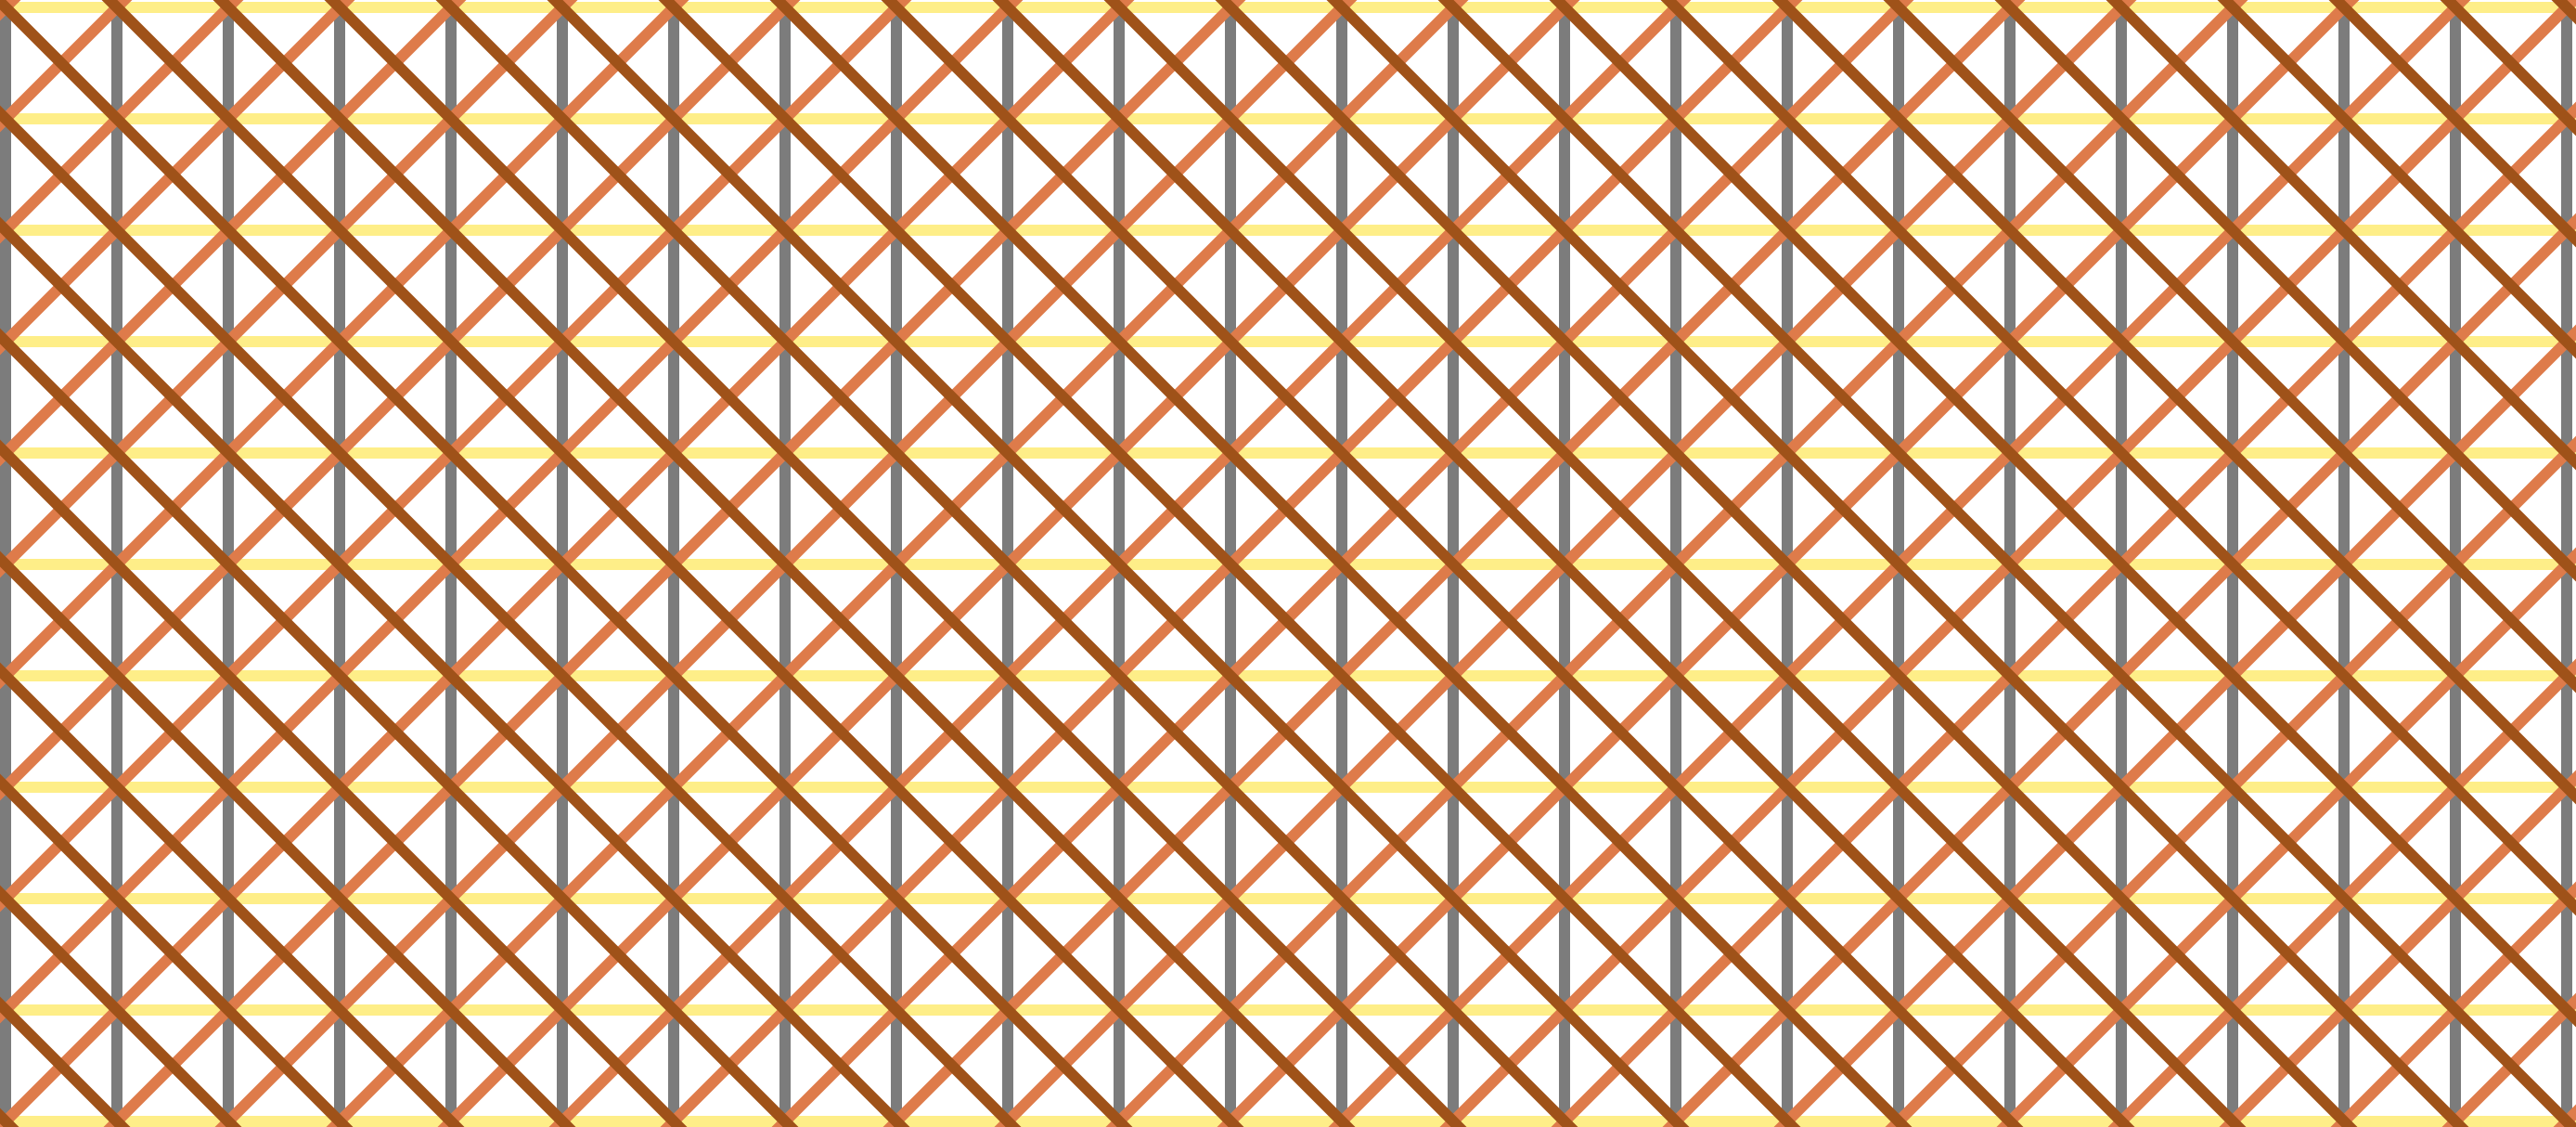
  • Sol LeWitt’s Wall Drawing 391 with D3.js


    Aren’t familiar with Sol LeWitt or his art? Read this.

    Wall Drawing 391: Two-part drawing. The two walls are each divided horizontally and vertically into four equal parts. First wall: 12-inch (30 cm) bands of lines in four directions, one direction in each part, drawn in black India ink. Second wall: Same, but with four colors drawn in India ink and color ink washes.

    391 is one of the iconic images that people instantly recognize as a Sol LeWitt. After making the simple line drawings, I wanted to try something more comfortable and a little more complex. Now that I’ve created this, I could translate it into #419. Perhaps I will do this in the future.

    Here is an image preview. Click on it to see the D3.js version:

    Open my D3 implementation of Wall Drawing 391 in a new window →

    Design Decisions

    • While any interpretation of Sol LeWitt’s instructions is technically valid as long as each statement is accounted for, I feel a responsibility to make my implementation beautiful, clean, and symmetrical.
    • Besides for this being a commonly recognized piece where it would be noticeable that I deviated from the norm, when I made this I was still unsure of myself. I wanted to see if I could translate what I saw in person to D3.js as closely as possible. I think it turned out pretty well.
    • When Sol LeWitt says “four colors”, the regular interpretation is black/dark gray, yellow, red, orange. When he says “four directions”, the common interpretation is 0 degrees, 90 degrees, 45 degrees, and 135 degrees.
    • Sol LeWitt dictated a 12-inch bands. Since inches are fuzzy on the web and regular screens aren’t as wide as walls, I scaled things down and translated it into pixels. I kept with the spirit and chose a multiple of 12: 36 pixel bands.
    • On a wall, the dimensions are dictated by the physical size of the wall itself. On the web, since windows change size so easily and the proportions of the art are constant, I chose to define a fixed size for this piece.

    Color Palette

    Onyx

    cmyk:
    78 72 66 74 1.00
    rgba:
    17 17 17 1.00
    hex:
    #111111

    Download color

    Sunglow

    cmyk:
    1 14 75 1 1.00
    rgba:
    252 202 66 1.00
    hex:
    #FCCA42

    Download color

    Alizarin Crimson

    cmyk:
    1 87 61 1 1.00
    rgba:
    223 34 62 1.00
    hex:
    #DF223E

    Download color

    Navy Blue

    cmyk:
    71 41 0 0 1.00
    rgba:
    16 105 213 1.00
    hex:
    #1069D5

    Download color

    Tools Used

    • D3.js – The D3.js library is well-suited to Sol LeWitt’s early works. D3’s foundational principle of joining data to elements is easy to apply to LeWitt’s symmetrical objects.
    • Textures.js – I’m using this library to quickly create the background patterns. It plays very well with D3.js, which is why I chose it. It is a great little library that is very easy to use. It has some limitations around the edges, but the alternative is writing my own SVG paths for the patterns, which I didn’t want to do at this time.

    Technical Details

    • I repurposed some of the data-generating code for the squares from my Let’s Make a Grid with D3.js post.
    • This is two SVGs with two groups each (one for each row) and two rect elements in each group (one for each quadrant). The only difference between the left and right SVG squares is the color.
    • The stripes are singular path fills in each square. There is only one pattern per quadrant here because this piece has simple, non-overlapping colors.
    • Want to dig in a little further? Check out my implementation and view source. All of the D3 specs are there.

    What I learned

    • There are tradeoffs to using libraries to generate patters for you. At the width of the squares I’ve specified here, the size of the pattern should be sqrt(2) times the size of the vertical one. When I run those calculations and set the diagonal patterns as such, the right one lines up but the left one is shifted too far up. I ended up finding a middle ground, but the stroke size of the bottom ones aren’t exactly 36 pixels wide. They are 37 pixels wide. That is the price I pay for using a library. I’ll learn to write my own SVG patterns in the future.
    • Many interpretations of Sol LeWitt’s directions (including ones he oversaw the installation of) are very geometric and symmetrical.

    Inspiration and References

    Wide shot of the version on display at MASSMoCA: Wide shot of the version on display at MASSMoCA:

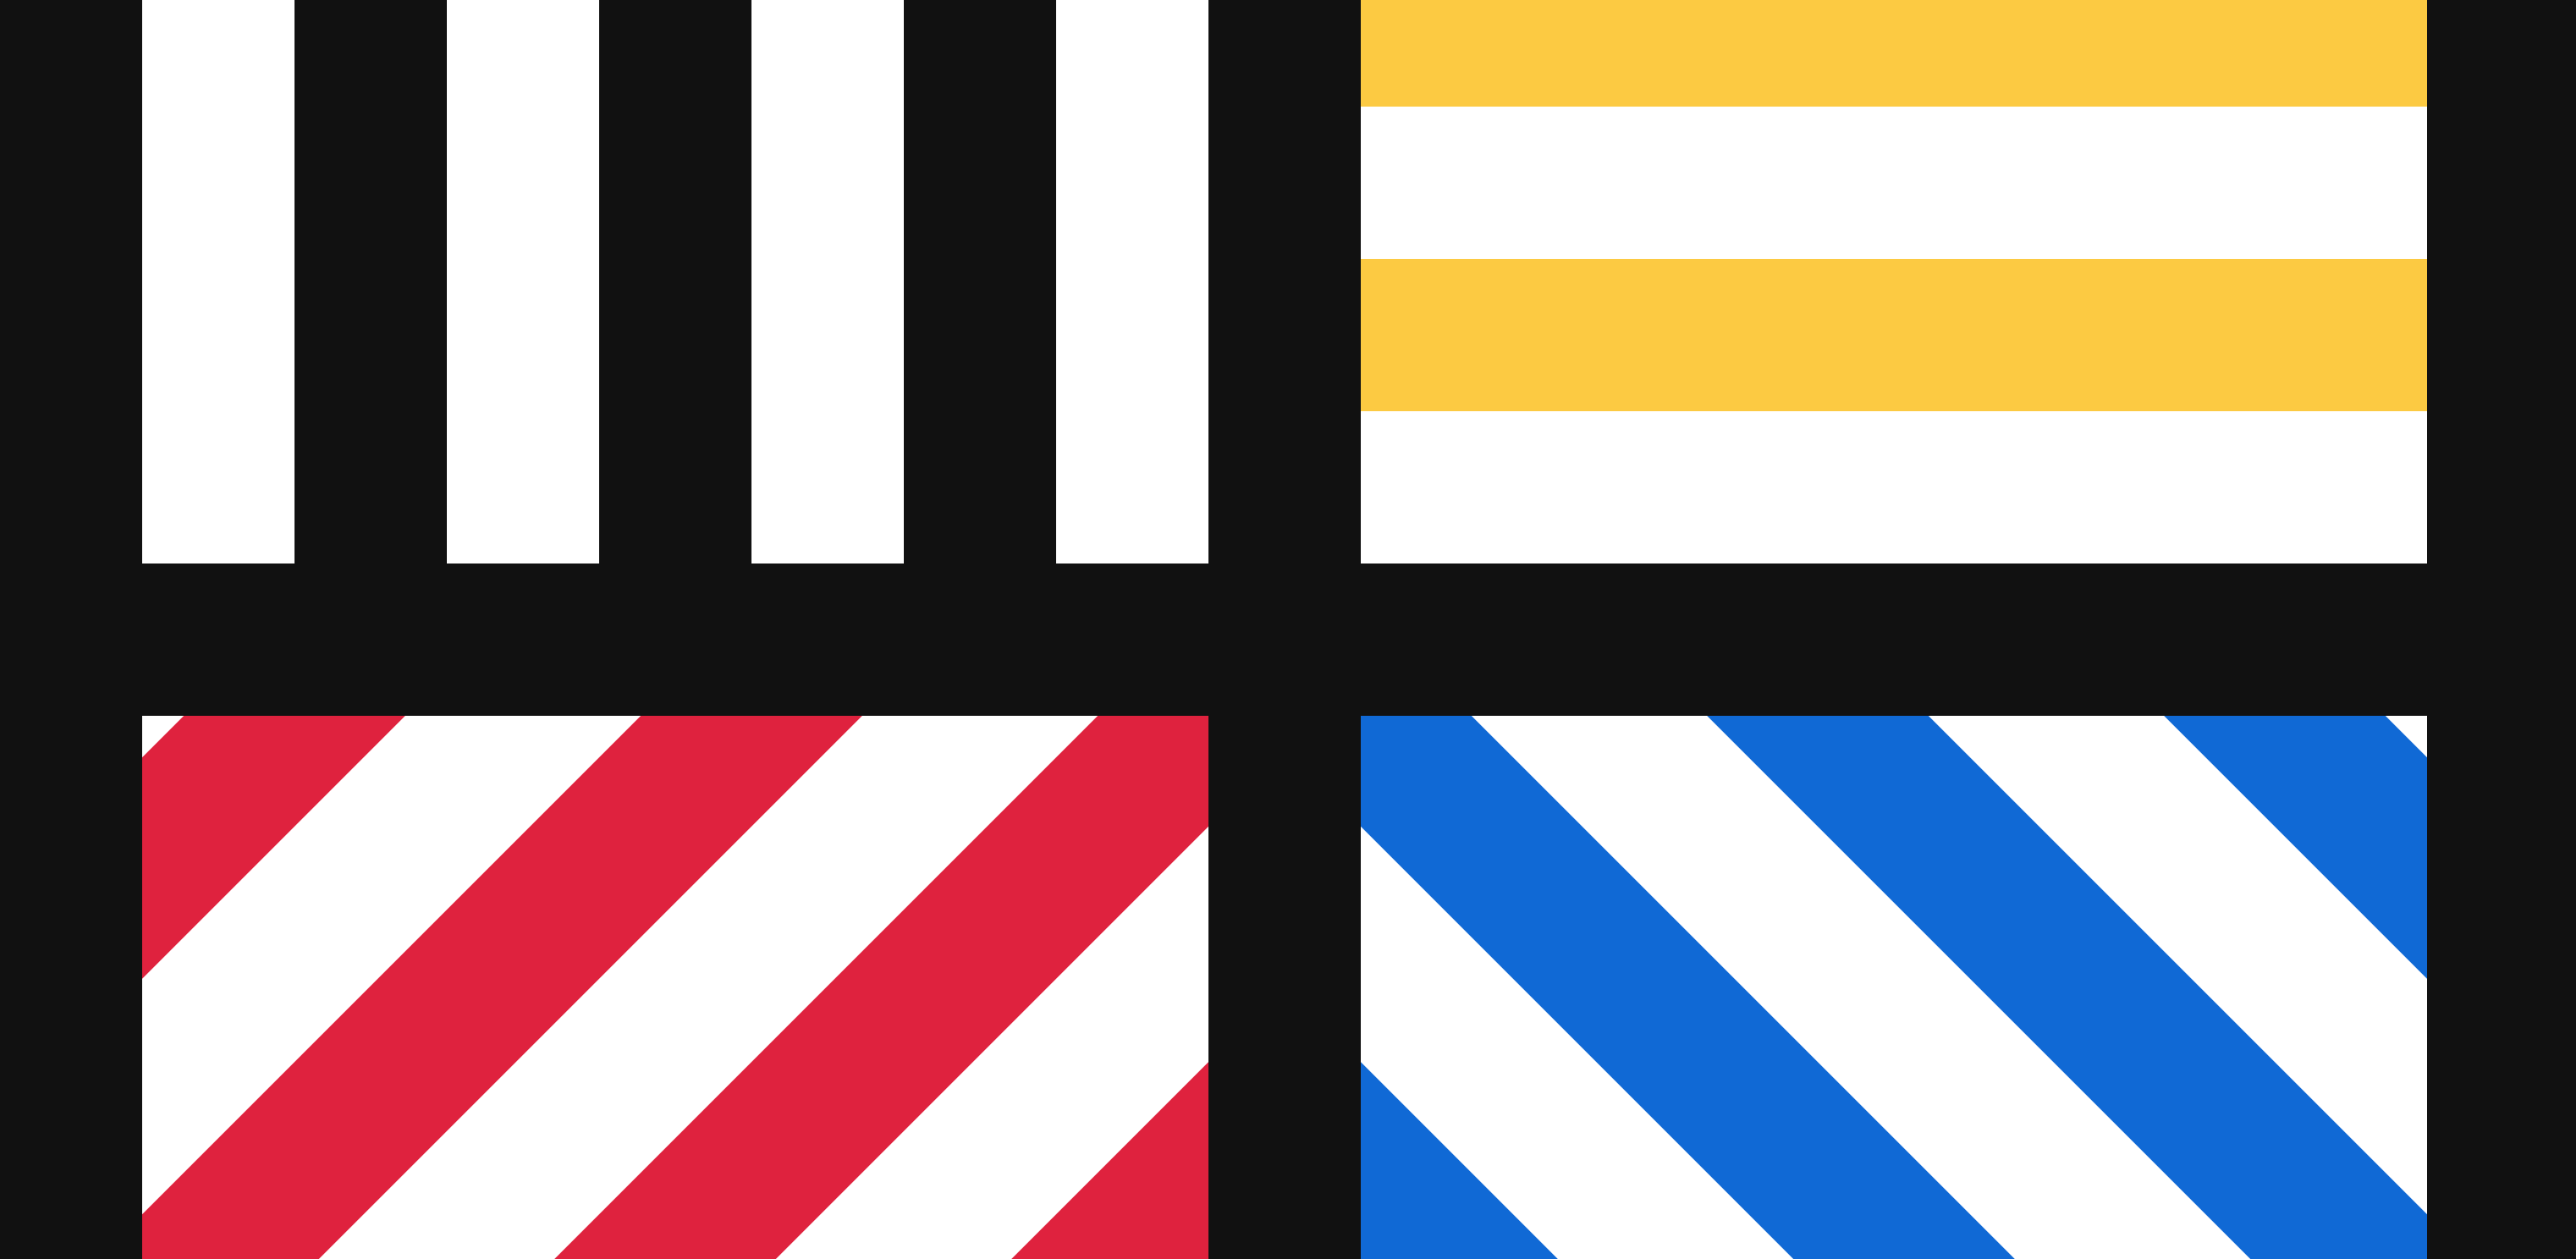
  • Sol LeWitt’s Wall Drawing 11 with D3.js
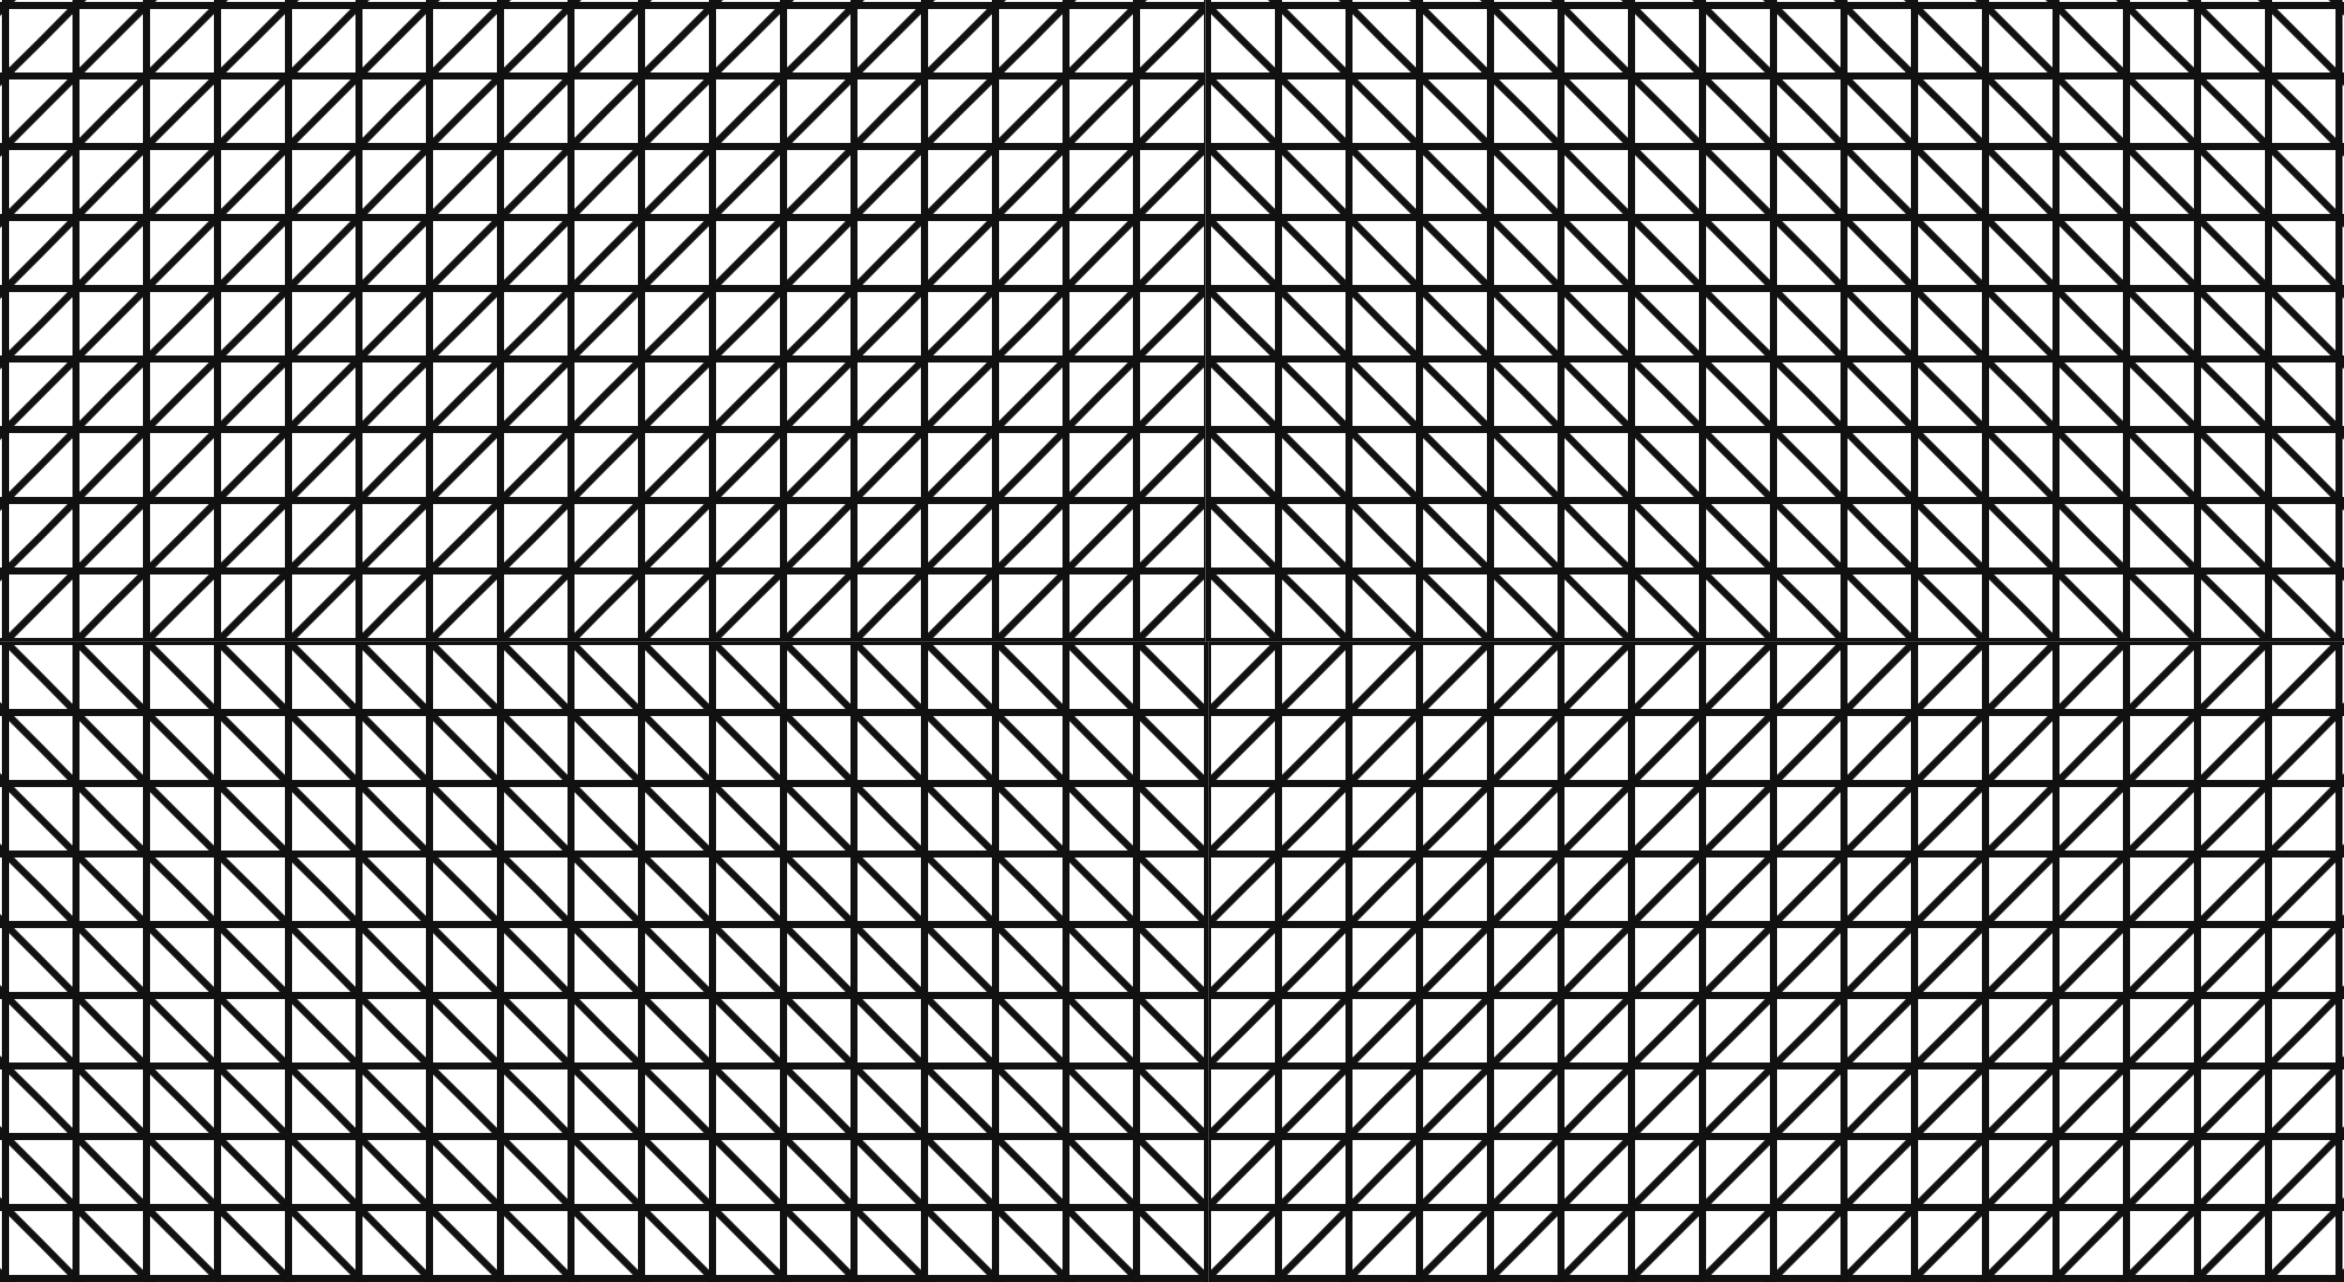

    Aren’t familiar with Sol LeWitt or his art? Read this.

    Wall Drawing 11: A wall divided horizontally and vertically into four equal parts. Within each part, three of the four kinds of lines are superimposed.

    Wall Drawing 11 is remarkably close to Wall Drawing 56, which is the first one I implemented. I discovered that with only a few changes (width, height, and pattern direction) I could turn my code for 56 into 11.

    Open my D3 implementation of Wall Drawing 11 in a new window →

    Design Decisions

    • While any interpretation of Sol LeWitt’s instructions is technically valid as long as each statement is accounted for, I feel a responsibility to make my implementation beautiful, clean, and symmetrical.
    • There are other valid layouts of this piece (the patterns could be in different directions as long as you use three), but I decided to implement the popularly known configuration currently on display at MASSMoCA. I will stray from this path later on in the project.
    • I reused most of the foundation I laid with Wall Drawing 56. I chose to change the dimensions to a rectangle to better fill the page and to differentiate it. A rectangle also stays closer to the version of 11 at MASSMoCA than a square.

    Tools Used

    • D3.js – The D3.js library is well-suited to Sol LeWitt’s early works. D3’s foundational principle of joining data to elements is easy to apply to LeWitt’s symmetrical objects.

    • Textures.js – I’m using this library to quickly create the background patterns. It plays very well with D3.js, which is why I chose it. It is a great little library that is very easy to use. It has some limitations around the edges, but the alternative is writing my own SVG paths for the patterns, which I didn’t want to do at this time.

    Technical Details

    • I reused most of the foundation I laid with Wall Drawing 56.
    • I changed the width, height, and starting point of each quadrant to make a rectangle instead of a square.
    • Want to dig in a little further? Check out my implementation and view source. All of the D3 specs are there.

    What I learned

    • I really got the hang of setting up patterns in multiple directions here and configuring them such that they line up to create a design where the edges meet.
    • Dimensions matter. I started out with this as a square, but I think it fits normal browser windows much better as a rectangle.
    • Reuse bits of code if you can!

    Inspiration and References

    Detail shot of the version on display at MASSMoCA: Detail shot of the version on display at MASSMoCA

    Wide shot of the version on display at MASSMoCA: Wide shot of the version on display at MASSMoCA:

  • Sol LeWitt’s Wall Drawing 56 with D3.js


    Aren’t familiar with Sol LeWitt or his art? Read this.

    Wall Drawing 56: A square is divided horizontally and vertically into four equal parts, each with lines in four directions superimposed progressively.

    Wall Drawing 56 was the first of Sol LeWitt’s wall drawings I tried to implement here on the web. I picked it for its simplicity: A square with four sets of patterns and two colors. I wasn’t sure exactly what interpreting and implementing these would entail, so I wanted something simple and recognizable at first.

    Open my D3 implementation of Wall Drawing 56 in a new window →

    Design Decisions

    • While any interpretation of Sol LeWitt’s instructions is technically valid as long as each statement is accounted for, I feel a responsibility to make my implementation beautiful, clean, and symmetrical.
    • There are other valid layouts of this piece (the patterns could be in a different order depending on where you chose to start), but I decided to implement the popularly known configuration currently on display at MASSMoCA. I will stray from this path later on in the project.
    • On a wall, the dimensions are dictated by the physical size of the wall itself. On the web, since windows change size so easily and the proportions of the art are constant, I chose to define a fixed size for this piece.

    Tools Used

    • D3.js – The D3.js library is well-suited to Sol LeWitt’s early works. D3’s foundational principle of joining data to elements is easy to apply to LeWitt’s symmetrical objects.

    • Textures.js – I’m using this library to quickly create the background patterns. It plays very well with D3.js, which is why I chose it. It is a great little library that is very easy to use. It has some limitations around the edges, but the alternative is writing my own SVG paths for the patterns, which I didn’t want to do at this time.

    Technical Details

    • I repurposed some of the data-generating code for the squares from my Let’s Make a Grid with D3.js post.
    • I had to do a lot of trial-and-error on the width, height, starting points for each quadrant, and pattern size to make sure the patterns turned out clean and symmetrical. If you dig into the javscript, you’ll see odd variable definitions.
    • This is one SVG with two groups (one for each row) and two rect elements in each group (one for each quadrant).
    • The lines/patterns are singular path fills in each square. There is only one pattern per quadrant here because this piece is in black and white.
    • Want to dig in a little further? Check out my implementation and view source. All of the D3 specs are there.

    What I learned

    • In this first implementation I was getting my feet wet with Textures.js. I got a solid understanding of how to define and create patterns with it.
    • When my first cut was pretty rough around the edges (literally, because the patterns had odd spacing), I noticed how precise and clean the other versions I’ve seen are. I now pay special attention to the fine details when evaluating these pieces.

    Inspiration and References

    Detail shot of the version on display at MASSMoCA: Detail shot of the version on display at MASSMoCA

    Wide shot of the version on display at MASSMoCA: Wide shot of the version on display at MASSMoCA: