
Concord
- cmyk:
- 44 36 33 1 1.00
- rgba:
- 124 124 124 1.00
- hex:
- #7C7C7C


I often get asked about what I use to get my work done. This post will be updated regularly with my current toolkit and setup.
Last updated: April 11, 2017
This list is broken into these major categories:
Coda by Panic is my IDE of choice. IâÂÂve been using it since it first launched and I stuck through the major 2.0 (and subsequently 2.5) release. It has highlighting, remote editing and publishing, previewing, SQL connectors, Terminal, regex search, and git support built in. Tons of third party add-ons available. IâÂÂve written AppleScripts for it and know most commands by heart, so IâÂÂm unlikely to jump ship any time soon.
TextWrangler is the text editor I launch if I just need to take a peek at something or quickly clean up some formatting. It is built on the BareBones engine and is ancient, but awesome.
I primarily develop on virtual machines to keep my environments separate. I use Virtual Box to run the VMs, Vagrant to manage them, and Laravel Homestead as my base development environment.
This site is powered by Jekyll and cooklikechuck.com is powered by WordPress.
I use Hover for buying and managing domain names and most DNS management. I use Cloudflare for DNS management on domains that I need SSL on because I love their Flexible SSL plan.
I use Homebrew for package management.
I use Backblaze for my offsite backup solution and Carbon Copy Cloner with miscellaneous Western Digital and Seagate drives for my onsite backups.
I use CleanMyMac once a week to clean out the junk that accumulates. I keep Hazel rules running constantly to automate organization on my Mac. The MacSparky Hazel Field Guide will teach you everything you need to know about it.
I use 1Password for secure password management. IâÂÂve also tried LastPass and Dashlane, but nothing can beat 1Password, both in terms of security and easy of use. IâÂÂve also use 1Password for Teams and it works just as well.
TextExpander has radically changed the way I work. If you ever type something more than once, make a snippet for it and save your keystrokes. I also launch scripts and templates from a few keys with this tool. We also recently adopted it at Praxis to keep our customer service answers consistent across staff members.
IâÂÂve searched for years for good bookmark management. Raindrop.io is exactly what IâÂÂve been searching for. I dropped Pocket and Instapaper entirely in favor of this.
We all need a good VPN, both for privacy and for development QC testing. IâÂÂve been using Private Internet Access for the past four years and am happy with it.
Setapp is a subscription tool for Mac apps. $10 a month gets you access to a ton of great apps. Here are the apps I regularly use from the Setapp bundle:
I use Safari, Chrome, and Firefox on a daily basis for browsing and testing. Here are plugins I use that make my life easier:
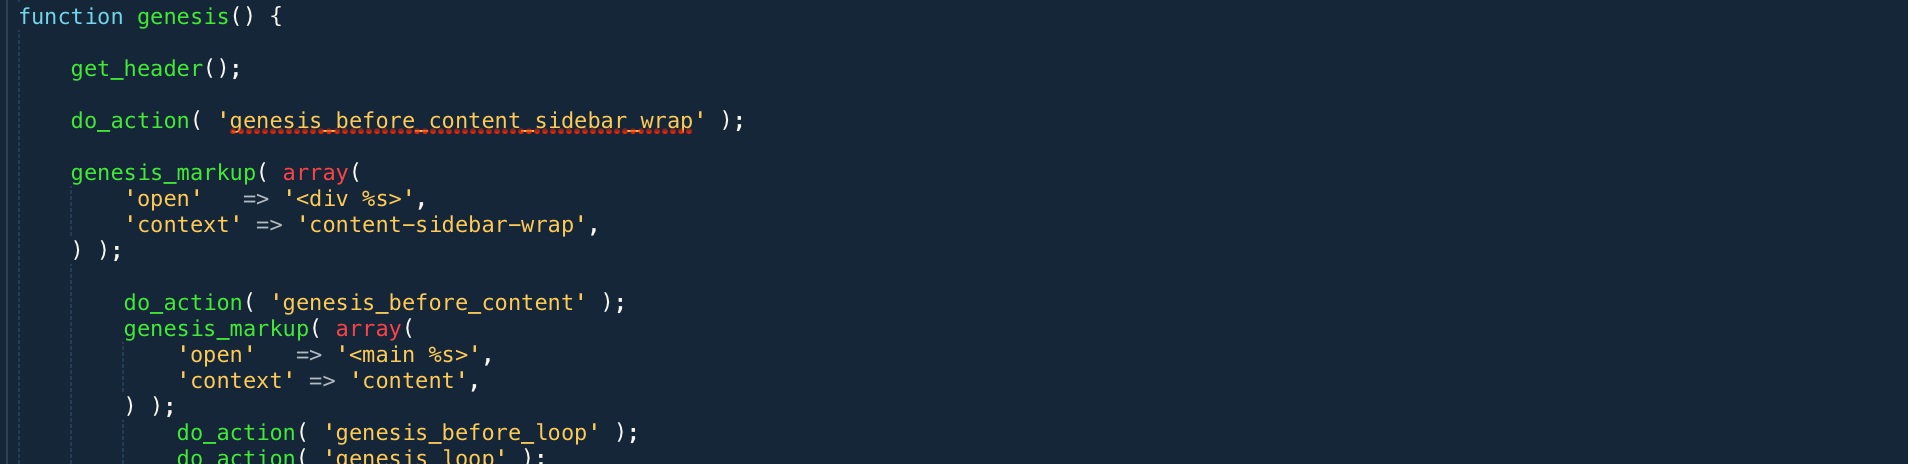
The Genesis Framework is super useful out of the box, but what if you want to color outside the lines?
Two weeks ago my coworker Derek Magill asked me to take a look at this awesome full width box on GrooveHQ’s website that has a testimonial box on one side a video on the other. This goes edge-to-edge, which means that it is impossible to make in most Genesis themes out of the box.

We want this to display on the front page, which means it needs to be a front page widget. I prefer hardcoding as little design details as possible in order to leave things as flexible and as reusable as they can be. This means that that architecture decision I chose is to not build the widget with dedicated area for the testimonial and video, but to just make the widget span the width of the full window instead of being constrained to the container. Everything else is going to be handled by HTML and Javascript inside the widget. That way we can reuse the full width widget for something else later if we no longer want the video.
In WordPress, you register things inside functions.php. Make sure you do it in your child theme, not the main Genesis parent theme. Since Genesis typically comes pre-loaded with 5 widget areas, I opted to give this one the ID front-page-6. You can choose whatever you want, but make sure you carry the same ID all the way through:
genesis_register_sidebar( array( 'id' => 'front-page-6', 'name' => __( 'Front Page 6', 'showcase' ), 'description' => __( 'This is the 6th section on the front page. It is full-screen.', 'showcase' ), ) ); In Genesis themes, the front page template is usually named front-page.php. This is where we’ll be putting this snippet. Find where the other front page widgets are output and add your new one in where you want it. Remember that in hard coded theme templates, the order matters. If you want it before all the other widget areas, you need to put the code that runs it first.
A normal widget area that doesn’t go full width would look like this:
genesis_widget_area( 'front-page-6', array( 'before' => '', ) ); But if you want to remove the padding around the edges of the widgets that keep them vertically in-line with the rest of the content, you’ll need to remove the
tags. Also remove the flexible-widgets class.
genesis_widget_area( 'front-page-6', array( 'before' => '', ) ); Here is what I opted to add:
.front-page-6 { background-color: #d64745; color: #fff; } .Aligner { display: flex; align-items: center; min-height: 24em; justify-content: center; } .Aligner-item { flex: 1; } .Aligner-item--top { align-self: flex-start; } .Aligner-item--bottom { align-self: flex-end; } .Aligner-item--fixed { flex: none; max-width: 70%; } I took the flexbox aligner styles from Philip Walton’s Github. I started using CSS back in version 1, so I’m still not used to this flexbox voodoo.
The widget won’t become active until content there is a widget added to it. If you are going to put HTML and Javascript in it, choose a Text widget. Paste your code in there. Here is what I cooked up for our video testimonial box:
class="two-fifths first Aligner"> class="Aligner-item Aligner-item--fixed"> Diana loves Praxis. Here's why... "Praxis gave me the skills and experience needed to run a sales team at the age of 18, when the rest of my peers were sitting in classes." More Customer Stories If you are looking for a great video hosting platform with a ton of options (like responsive embeds and private access), check out Wistia.
This isn’t ready to go live on the site yet because we are working on new videos to put in the block, so here is a screenshot with demo content. You’ll notice that I made the video a little larger than the text box (2/5 vs 3/5) because I wanted the focus to be on the video.


If you are using a static site builder like Jekyll, Amazon S3 is one of the cheapest hosting solutions around. To speed up delivery time for a little extra cost, I recommend using Cloudfront in front of S3.
A few months ago I decided to serve my static assets from S3, but yesterday I decided to take the full jump. Here is what I did to make the move.
This full guide will be most useful for static sites on existing hosting solutions that you are moving to AWS while using outside DNS services. This guide uses s3_website, Amazon S3, Amazon Cloudfront, and a non-Amazon DNS service.
If you are setting up a site from scratch, use Amazonâs guide instead.
The steps below worked for me, but I canât guarantee everything will work for you. Back up your stuff so you can roll back. Youâve been warned.
Really, before you make a mistake and mess a bunch of stuff up, make sure you have a back up of everything:
Set up an account at Amazon Web Services.
s3_website is a very useful tool for automatically setting up buckets on S3 and a Cloudfront distribution to host a static site. It also helps easily deploy updates to your static site with a few commands.
Follow the toolâs instructions on Github.
s3_website cfg create. This generates a configuration file called s3_website.yml.s3_website.yml file.s3_website cfg apply. This will configure your bucket to function as an S3 website. If the bucket does not exist, the command will create it for you. When you run this, it will ask you whether you want to deliver your website via CloudFront. If you answer yes, the command will create a CloudFront distribution for you.If you have content on your webserver that doesnât exist in your Jekyll site, youâll need to set some extra configurations for those things in the s3_website.yml. For example, I serve a bunch of PDFs that are separate from my actual Jekyll instance. If you do, too, make sure you take advantage of the ignore_on_server section of the configuration. Make sure to uncomment it (remove the # in front of it) and list the folder paths from the root that you want the tool to ignore on the server. Otherwise folders not on this list and not in your Jekyll site will be removed.
I added these:
ignore_on_server: - justanswer - illum Reminder: Donât use tabs for formatting in YAML files. Use spaces.
Run a new build on your Jekyll site: jekyll build
Then, push up to the AWS environment: s3_website push
Donât worry, even though the s3_website.yml gets added to your _site folder, it wonât get uploaded to S3. The tool skips it. I triple checked this because I didnât want to publish my access keys online.
Wait 15 or 20 minutes for your site to propagate across Cloudfront (the Cloudfront dashboard shows the propagation status.) Once it does, check your Cloudfront domain (or public S3 domain if you arenât using Cloudfront). The s3_website tool gives you both domains during your initial setup, or you can always get them from your AWS console at any time. For example, my Cloudfront domain for this site is d27zm8z2abfvhn.cloudfront.net and my S3 domain is http://cagrimmett-jekyll.s3-website-us-east-1.amazonaws.com.
Check the domains and make sure everything seems to be live and working correctly.
First, add your domain, including the www, as a CNAME on your Cloudfront distribution. This allows Cloudfront to serve requests to this domain once it is point there. This is the easy part.
I have a bunch of DNS records on cagrimmett.com, so I didnât want to migrate my DNS over to Amazonâs Route 53. That means I had an hour of trial and error (as well as a consultation from my friend Eric DavisArchived Link) figuring out how to get things to work. Also, the typical A record pointing wonât work because the IP addresses to Amazonâs servers change regularly.
The solution we settled on is: CNAME the www subdomain to Cloudfront and forward all cagrimmett.com requests to www.cagrimmett.com.
To CNAME your www subdomain to Cloudfront, just log in to your DNS service and add a new CNAME record for www (or change the existing one if you have it) and point it to your Cloudfront domain, which is the one that looks like this: d27zm8z2abfvhn.cloudfront.net.
You have two options for forwarding non-www requests to the www subdomain:
A) If you arenât using your domain for anything except this site, you can use your DNS serviceâs domain forwarding tool if it has one. Set it up to forward domain.com to http://www.domain.com. Note: If you are using your domain for anything else or if any subdomains point to the @ record, donât use this option. I tried this and took down my other sites, which are served from subdomains of cagrimmett.com.
B) Use Apache or nginx to rewrite requests. This means that you still need your original hosting, but it will only be used to rewrite your domain requests. This isnât an issue for me because I still need my hosting to serve cooklikechuck.com, amandakate.me, and my dev and staging areas for WordPress development. This option isnât ideal, and definitely not what I would have designed from the beginning, but I donât want to burn everything down and start over. So Apache it is. Here is what my rewrite rule looks like in my .htaccess file:
RewriteEngine On RewriteRule ^(.*) http://cagrimmett.com/$1 [QSA,NC,NE,R,L] This takes any non-www requests and rewrites them to the www subdomain, preserving the whole query string, making sure existing links to your content around the web donât break.
Wait an hour for all changes to take affect and you should be good to go!
Since we used s3_website, deploying updates and new posts to your site will be super easy:
Navigate to your Jekyll site folder and build your Jekyll site: jekyll build
Then push up to the AWS environment: s3_website push
Thatâs all!
I opted to not use SSL for my site right now because there are a ton of extra steps and extra cost involved. Iâll probably revisit this later when Google starts penalizing non-secure sites, but for the time being Iâm sticking with plain http. Iâm not collecting any user-submitted data.

Hubspot is an easy-to-use marketing and sales CRM. It is a lightweight alternative to Salesforce and Microsoft Dynamics that has a ton of marketing and sales functionality.
This week I dug in to it and found some lesser-known features:
What if your workflow involves emailing contacts to get them to fill out a form, like an Application form? It is annoying for the user to fill out information you clearly already have, such as Name and Email Address. Smart Forms are a partial solution to this problem, but don’t work if people fill out one form on their computer and another on their phone three days later.
After some digging, I found out that Hubspot allows you to assign information about your contact to variables and append them as query strings on URLs.
This means you can set up email templates to make it unnecessary for your customers to type information over and over. Awesome.
Any time you drive someone to a form via email, you should use query strings to automatically fill things for them.
Hubspot’s Content Optimization System (COS) is essentially a landing page and content platform hosted on Hubspot. You usually set it up on its own domain or subdomain and it is useful for tracking user interactions. Let’s say you are no longer using a COS page, but it is linked somewhere and people keep hitting it. What do you do?
I found the solution buried a few levels deep into the Marketing platform. There is a URL redirect tool built in.
Hubspot connects with Zapier, so it connects automatically with 750+ apps. New contacts, contact updates, calendar tasks, social media messages, and form submissions can kick off workflows.
For example, you can:

There is but one cure for ignorance: enlightenment! Lesser treatments, such as ‘selling the masses,’ political activism, and the like, are an utter waste of time; as well try to bring daylight by cursing the darkness!” (To Free or Freeze, p. 18)

I got the chance to spend a week driving from coast to coast with my parents last summer. We started just north of Seattle, took Route 2 across Washington, Idaho, Montana, North Dakota, Minnesota, and Wisconsin, then went across the UP and drove down through Michigan, then across Ohio and Pennsylvania on I-80 to NYC.


We left Bellingham after meeting a friend for an early lunch and decided to cross Washington all in one day. It went like this: The Cascades, apple orchards, then endless wheat fields. Somewhere in the middle of apple country we found an awesome burger shack and decided to stop for dinner. The cheeseburger and a banana shake hit the spot.


We thought weâd drive to Spokane and just Priceline a hotel when we got there. Rookie mistake. Since it was the summer season and there was an unforeseen issue at the airport that grounded all flights, literally every hotel within 50 miles was booked. Even the casinos were booked. Thankfully, some gracious friends from college, the Herseys, offered to let us stay with them an hour away in Coeur dâAlene, ID.

The first thing we did the next day was book hotels for the rest of the trip. We werenât going to get lucky with nearby friends while going across the plains. We then took a leisurely route through the mountains to get over to Glacier National Park. We explored Lake McDonald, the Trail of the Cedars, and Avalanche Creek.


The next day we got up early, went across Going To The Sun Road, and drove up to Waterton, Glacierâs sister park in Canada.
The drive took longer than expected, so I had to sprint to buy us tickets for the boat tour of Upper Waterton Lake. It was well worth it. We saw some incredible scenery and caught a glimpse of a momma black bear and her cubs. I got a proper sunburn, got my shoes wet, and took hundreds of photos. A good day, all in all.


We got up early, drove around the southern edge of Glacier, saw a moose, and settled in for a long drive across the plains. We set Minot, ND, as our destination for the day, which was a 15 hour drive across hot, dry, flat, featureless land. Thank goodness for podcasts! Lunch options were slim, so we found a grocery store and bought stuff for sandwiches, which we assembled and ate in the parking lot.

Dinner options were slim, too. The plains are an empty place. We had dinner at The Taco Shack in Glasgow, MT, the only town we saw for hours. I got their special, âThe Emmetâ: a plate of tater tots covered in taco meat and cheese.


After a short night of sleep (we arrived late in Minot), we got back on the road and made for Marquette, MI. After about an hour and a half on the road, we cruised through Rugby, ND, and made a quick stop at the geographical center of North America.

I had to work for the last four days of the trip, which was challenging. I got up early, stayed up late, took phone calls at rest areas, and answered emails in the back seat when I wasnât driving.
We stopped at Duluth TradingArchived Link in Duluth, MN, then kept on trucking. I was exhausted by this point, so all I remember is 1) how many bugs hit our windshield in the UP and 2) how flat the UP is. I expected it to be more hilly for some reason. We rolled in to Marquette around 1:30am and passed out immediately.
The next morning, we realized that there were so many bugs splattered across the windshield that we had to wash it at the next gas station.

We had planned on spending the day exploring Pictured Rocks and the Sleeping Bear Dunes, stay the night up there, and drive to Cleveland the next day, but we were so exhausted that we opted to skip the dunes and drive to Cleveland that day. We took our time around Pictured Rocks, then I shot a hyperlapse of going across the Mackinac Bridge and we cruised all the way down to Zingermanâs in Ann Arbor for dinner. After stuffing our faces with fantastic sandwiches, we drove the last two hours back to the Cleveland area.

I stayed at my parentsâ house for two nights, which was just enough time to visit with family and get my favorite pizza.


I took I-80 across Pennsylvania back to NY by myself on day 8, completing the trip. Iâve taken that 8 hour trip dozens of times over the past 5 years, but after driving 12+ hours a day for the previous week, I was ready to get out of the car. I didnât even take any photos!


Do you want to be on top in your field? The bar is lower than you think, but few people even attempt to jump it. They will talk about jumping over it, but when it comes time for them to make the leap, they step back.
You don’t have to be smarter than your peers, start out with more money than the other people in your class, or have better tools than the competition.
You just have to be more persistent than them. Show up and do the work every single day. Keep pushing forward when others stop.
Attributing success to luck is an excuse we tell ourselves. Saying, “You are lucky to have made that huge sale!” ignores the reality that sales are more likely to happen when someone puts in the work to generate and follow up with leads.
Whatever it is you want to be the best at, go out and do more of it. Take it a day at a time. Move forward in a meaningful way each day.
It takes a lot of work. Determination won’t be enough. You’ll need to build habits and design systems that keep you on track. On the days when you are sick, didn’t sleep enough, and just don’t feel like doing it, you’ll need routines to turn to that allow you to keep moving forward.
What you have going for you is that very few people are willing to do this. If you actually show up, push through, and ship more work than everyone else, you’ll be surprised at how much easier it is to reach those rungs above you on the ladder.
It doesn’t matter whether you are a manual laborer, financial analyst, server at a restaurant, executive, budding author, carpenter, or musician. The path to the top is the same:
Do more. Improve on the things that don’t work. Repeat this process every single day.
Get the picture?
You know what you need to do. Stop wishing you were doing it and go out and do it. The only thing standing in the way is you.
—
These ideas aren’t original, but they are worth repeating. The ideas in this post came from listening to a Design Matters podcast with Seth Godin, chatting with Isaac Morehouse, watching a Gary Vaynerchuk video, talking with my Dad, and observing Derek Magill.


Earlier this week I looked at my web hosting’s usage stats and decided that I needed to move a bunch of static assets (mostly PDFs) somewhere else because they were eating my available bandwidth. A bunch of hot links around the web caused some usage spikes.
I’m a firm believer in learning by doing, so I decided to use this opportunity to learn a bit about Amazon Web Services and set up an S3 bucket from which to serve my static assets. To my surprise it took less than an hour to get everything up and running.
This guide is for people who want to use S3 to host some static files to lower their hosting costs. If you want to host your whole static site (Jekyll, Hugo, etc) on S3, follow this guide. If you are using WordPress and want to host your images on S3, follow this guide instead.
Set up an account with the Free Tier. If you are getting a decent amount of traffic, you’ll quickly run over the free limit of 5 GB of Standard Storage,20000 Get Requests, and 2000 Put Requests. It took me about a week to pass it up. Thankfully, S3 is much cheaper than paying for additional bandwidth on A Small Orange, so I’m still ahead.
One note that I’ll expand upon later: By checking the logs, I discovered that the majority of the hits are coming from 5 IP addresses that all resolve to Cloudflare. I have Cloudflare running on my site for caching and SSL, which means they regularly crawl my site and cache the assets. This ate through my Free Tier limits in just one week. If you use Cloudflare for caching, I suggest turning it off unless you know you need it.
Create a new bucket. The region mostly doesn’t matter unless you know that the bulk of your traffic comes from one place. If it does, pick the closest region. Make sure you enable logs when it prompts you. This will be useful for tracking & analytics later.
Now that you have your first bucket, it is time to put stuff in there. If you have a local backup of your website (and you should), identify the directories where you store static content like images, PDFs, HTML, CSS, Javascript, etc. No files ending in .php or .rb – those are server side files that can’t be executed on S3.
You can upload straight from the browser or you can set up access keys to connect via a file transfer client. I use Transmit for my file transfer needs, but CyberDuck is a good free alternative. Both have options for connecting to S3 buckets.
When you upload files, try your best to keep the same folder structure from your website root. That will make writing redirects to S3 easier.
Once you’ve uploaded some files, make sure you can access them through the browser by setting the permissions to Public. You can do this on a file-by-file basis or by selecting all of your files, clicking the “More ↓” dropdown, and clicking “Make Public”. Now verify that you can reach your asset by going to http://s3.amazonaws.com/[YourBucketName]/[filepath]. For example, my website’s avatar is available at http://s3.amazonaws.com/cagrimmett/img/avatar.png
If that worked, your assets are now available on S3. Now it is time to redirect traffic to them.
I’m assuming here that your server is using Apache and you have access to your .htaccess file. If you are using IIS instead, refer to this.
Remember, always make website backups before doing anything that some guy on the internet tells you to do.
Here are the rewrite settings I’m using in my main .htaccess file:
RewriteEngine On RewriteRule ^justanswer/(.*) http://s3.amazonaws.com/cagrimmett/justanswer/$1 [QSA,NC,NE,R,L] RewriteRule ^img/(.*) http://s3.amazonaws.com/cagrimmett/img/$1 [QSA,NC,NE,R,L] RewriteRule ^static/(.*) http://s3.amazonaws.com/cagrimmett/static/$1 [QSA,NC,NE,R,L] Here is what each line does:
RewriteEngine On – Turns on the ReWriteEngine so we can use it.RewriteRule ^justanswer/(.*) http://s3.amazonaws.com/cagrimmett/justanswer/$1 [QSA,NC,NE,R,L] – Takes any request to any file in http://cagrimmett.com/justanswer/ and forwards that request to http://s3.amazonaws.com/cagrimmett/justanswer/. Since I kept my folder structure, this works perfectly. The other two entries are similar. – QSA = Query String Append – NC = No Case – NE = No Escape – R = Redirect – L = Last – More info here: https://wiki.apache.org/httpd/RewriteFlagsAfter I turned it on, I gave it a few minutes to update and then checked my site. When I right clicked to open images in a new tab or tried to download an existing PDF, I got forwarded to AWS! Success!
If you enabled logging back in the setup step, you can plug in some third party tools to parse the logs into useful analytics. I’m currently trying out two tools: S3Stat and Qloudstat.
Pros/cons:
First, check out the docs.
If you still have questions or run into issues, drop a comment below and I’ll get back within a few days to help.
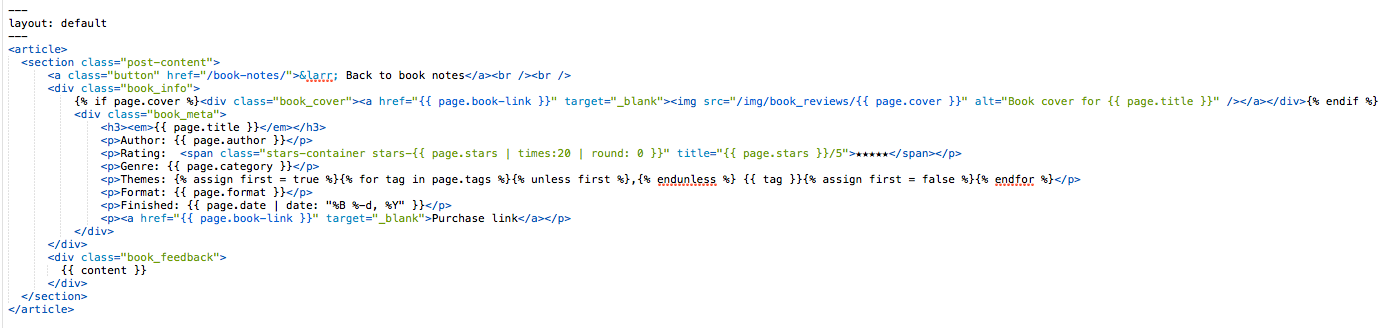
I started taking notes on books I’m reading and collecting them on my website as reviews, so I thought I’d make the template I wrote public on Github. It is part of my ongoing set of Jekyll tools. No plugin necessary, so it should work on Github Pages.
Download the code from my Github repository
A working demonstration of this collection can be seen at http://cagrimmett.com/book-notes
Here is a preview of a book review detail:

All assets for this collection can be found in the book-reviews folder in this project.
1) You first need to register the collection in _config.yml. Append this to the bottom of your current _config.yml or, if you already have a collection registered, add another entry. This same example is :
# Collections collections: book_reviews: output: true output_ext: .html permalink: /book-reviews/:path/ 2) Place the _book_reviews folder and the book-reviews.html file in your Jekyll site root. This is the same folder that contains the _config.yml and _posts folder.
3) If you use Sass, place the contents of _book_reviews.scss file in your main Sass file. If you don’t use Sass, you’ll need to rewrite the media queries (the first 45 lines) in regular CSS.
4) Write your book review and place it in the _book_reviews folder (an example is included). The rating is out of 5 stars and supports half stars. The templates assume that your images are stored in an img folder in your site root. Example: yoursite.com/img/book_cover_image.jpg If you want the example_review.md to work, make sure you put img/deep_work.jpg in your site’s img folder.
--- layout: book-reviews-template title: Deep Work - Rules for Focused Success in a Distracted World author: Cal Newport category: Self-Improvement tags: - Time management - Work - Focus stars: 4 book-link: http://amzn.to/2gaSjqy cover: deep_work.jpg format: Audio Book date: 2016-11-28 excerpt: "Deep work is the ability to focus without distraction on a cognitively demanding task. It produces great results." --- After hearing a few interviews with Cal Newport on podcasts, I decided to pick this up. The book is divided into two main sections: The idea or "why" behind deep work, in which Newport tries to convince you it is necessary. I more or less bought in to this before listening to the book, but I listened to it anyway. The second part are the rules for how to do deep work. Newport writes this from an academic's point of view, but there are definitely universal principles you can apply. span setup controlling the width for color fill, and some Liquid to calculate the CSS class value:{{ page.stars | times:20 | round: 0 }}" title="{{ page.stars }}/5">★★★★★og:image field.book-reviews.html page or the book-reviews-template.html template to work well with your layout. I’m assuming that if you use Jekyll, you probably know what you are doing. If not, drop me an email and I’ll try to help.

It’s not just the balloons at the Macy’s Thanksgiving Day Parade that are inflated.
Each year the American Farm Bureau Federation collects an informal price survey for a typical Thanksgiving dinner. The shopping list has remained the same for the past 31 years: turkey, bread stuffing, sweet potatoes, rolls with butter, peas, cranberries, a veggie tray, pumpkin pie with whipped cream, and coffee and milk, all to feed a family of 10.
At first glance, it seems like the price of food has trended upward since 1986. Once you adjust for inflation, however, you get a different story. The inflation-adjusted price has stayed relatively flat over time with minor fluctuations. The purchasing power of our currency in circulation has gone down over time, driving up the price of goods.
As Mark Perry points out, this is no reason for despair. The average hourly wage of the American worker has increased steadily, making Thanksgiving more affordable than ever. That is something to be thankful for this year.
The data for this chart was collected by the American Farm Bureau Federation. I adjusted this price data for inflation using the BLS’s CPI Inflation Calculator. The chart was built using Chart.js.
I retooled my original 2014 version. I paid closer attention to colors and made this one responsive. I think it is a big improvement!
This was also published over at FEE’s Anything Peaceful blog.

Aren’t familiar with Sol LeWitt or his art? Read this.
I had an insight while going through the D3.js documentation to find a solution to another piece: d3.area() with a highly curved fit line isn’t that different from wall drawings 852 and 853! By the way, 852 and 853 are actually distinct pieces, though they are often grouped together into one display like the one at MASSMoCA. I worked on the solution to 852 first, then modified it to make 853:
Wall Drawing 852: A wall divided from the upper left to the lower right by a curvy line; left: glossy yellow; right: glossy purple.
Wall Drawing 853: A wall bordered and divided vertically into two parts by a flat black band. Left part: a square is divided vertically by a curvy line. Left: glossy red; right: glossy green; Right part: a square is divided horizontally by a curvy line. Top: glossy blue; bottom: glossy orange.
Here are previews of 852 and 853 respectively:


Open my D3 implementation of Wall Drawing 852 in a new window →
Open my D3 implementation of Wall Drawing 853 in a new window →
They are also available as blocks: 852 853
So much of implementing these drawings with D3.js rely on making a solid, usable data set to join elements with. (After all, D3 stands for data-driven-documents.) Creating these data sets is where I spend most of my time. Once I’ve created them, everything else follows pretty quickly.
Since d3.area() makes an area graph with given points, I had to create a data set of points. I wanted the start and end points to be defined with random (but constrained) points in the middle. Here is what I came up with for 852:
var ww = window.innerWidth, wh = window.innerHeight; function getRandomArbitrary(min, max) { return Math.random() * (max - min) + min; } function lineData() { var data = new Array(); for (var point = 0; point < 5; point++) { var x = getRandomArbitrary(ww/10, ww-ww/10); // Constrains within the middle 80% var y = getRandomArbitrary(wh/10, wh-wh/10); data.push({ x: x, y: y }) } // Starting point upper left data.push({ x: 0, y: 0 }); // End point lower right data.push({ x: ww, y: wh }) return data; }For 853, things were a little trickier since the left is oriented vertically:
var ww = window.innerWidth, wh = window.innerHeight - 80, halfwidth = ww/2 - 60; function getRandomArbitrary(min, max) { return Math.random() * (max - min) + min; } function fillLeft() { var data = new Array(); for (var point = 0; point < 3; point++) { var x = getRandomArbitrary(halfwidth/10, halfwidth-halfwidth/10); // Keeps within the middle 80% var y = getRandomArbitrary(wh/10, wh-wh/10); data.push({ x: x, y: y }) } data.push({ x: halfwidth/2, y: 0 }); data.push({ x: halfwidth/2, y: wh }) return data; } function fillRight() { var data = new Array(); for (var point = 0; point < 3; point++) { var x = getRandomArbitrary(halfwidth/10, halfwidth-halfwidth/10); // Keeps within the middle 80% var y = getRandomArbitrary(wh/10, wh-wh/10); data.push({ x: x, y: y }) } data.push({ x: 0, y: wh/2 }); data.push({ x: halfwidth, y: wh/2 }) return data; } One of the most important things to note about d3.area() is that you must sort your data sets (by x if the chart is horizonal, y if vertical) before passing them to the function. Otherwise you end up with something like this because the values are out of order:

D3 has selection.sort() built in, but you also need to pass a function telling it how to sort:
.sort(function(a,b) { return +a.x - +b.x; }) // Sorting by x ascending .sort(function(a,b) { return +a.y - +b.y; }) // Sorting by y ascendingMost area charts tend to be horizontal, and nearly all examples you can find are structured in this way. You need to pass .x, .y0, and .y1:
var area = d3.area() .x(function(d) { return d.x; }) .y0(window.innerHeight) .y1(function(d) { return d.y; }) .curve(d3.curveBasis);If you are switching to a vertical orientation, you instead need to pass .y, .x0, and .x1:
var areaLeft = d3.area() .x0(0) .x1(function(d) { return d.x; }) .y(function(d) { return d.y; }) .curve(d3.curveBasis);I played with a number of curve functions and a number of points to see how they compared to traditional interpretations of Sol LeWitt’s pieces:
I eventually settled on curveBasis for both pieces. It creates the smoothest curving line with the given random points, which produces results similar to the curved lines in Sol’s earlier work. curveCatmullRom was my second choice, but occasionally produced harsh concave regions.
For the larger standalone piece (852) I used 7 total points, including the end points. For 853, which consists of two different curves, I used 5 points each since the widths were smaller.
When you resize the screen, the divs gets destroyed and then rebuilt based on the new screen size. Here is the function I use to handle that. It is the same thing I used on 86 and on my Jekyll posts heatmap calendar. I wrapped the D3 instructions in its own function, called that function on first load, then wrote a function to destroy the node divs when the screen is resized and reexecute the D3 instructions after the screen resize ends. I’m sure it can be done with regular javascript, but jQuery makes this kind of thing fast and easy:
// run on first load sol852(); $(window).resize(function() { if(this.resizeTO) clearTimeout(this.resizeTO); this.resizeTO = setTimeout(function() { $(this).trigger('resizeEnd'); }, 500); }); //resize on resizeEnd function $(window).bind('resizeEnd', function() { d3.selectAll("div.node").remove(); sol852(); });Detail shot of the version on display at MASSMoCA:

It is also available as a block.
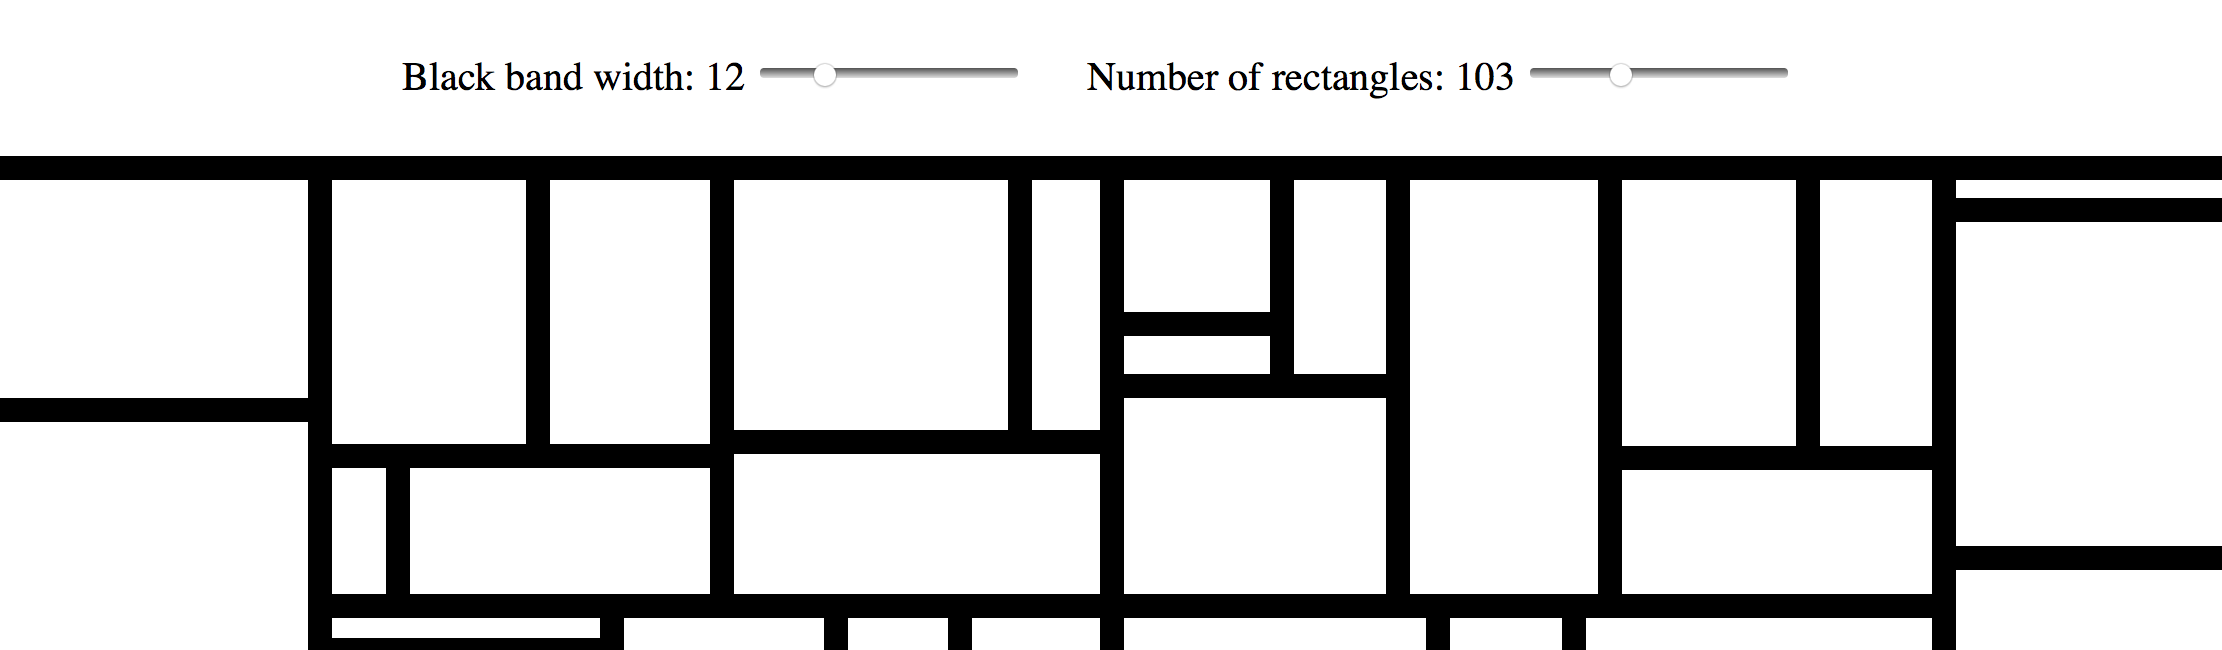
Here are Sol’s original instructions for Wall Drawing 614:
Wall Drawing 614: Rectangles formed by 3-inch (8 cm) wide India ink bands, meeting at right angles.
For the technical details of making the drawing itself, check out my post on it. This post focuses on rebuilding the tool based on user input.
I used a form, a range input, an output, and some in-line JavaScript to power the sliders and display their values in real-time:
Black band width: type="range" name="paddingInput" id="paddingInputId" value="15" min="1" max="50" oninput="paddingOutputId.value = paddingInputId.value"> name="paddingOutput" id="paddingOutputId">15px /> Number of rectangles: type="range" name="rectInput" id="rectInputId" value="40" min="5" max="300" oninput="rectOutputId.value = rectInputId.value"> name="rectOutput" id="rectOutputId">40 Live example:
A set a variable to the element I wanted to access, then I called the .value of that element in my functions. (See the post on 614 for more info about these functions.)
var padding = document.getElementById("paddingInputId"); var rectNumber = document.getElementById("rectInputId"); function treeData() { var obj = {name: "rect"}; var children = []; for (var row = 0; row < rectNumber.value; row++) { children.push({id: row, value: getRandomArbitrary(60, 1000)}) } obj['children'] = children; return obj; } var treemap = d3.treemap() .size([width, height]) .padding(padding.value) .round(true) .tile(d3.treemapBinary);Similar to rebuilding on screen resize in the original version, I detect when there is a change in one of the inputs and then call a function to remove the divs and rebuild the treemap based on the inputs. jQuery makes this kind of thing fast and easy:
$( "#paddingInputId" ).change(function() { d3.selectAll("div.node").remove(); sol614(); }); $( "#rectInputId" ).change(function() { d3.selectAll("div.node").remove(); sol614(); });Want to dig in a little further? Check out my implementation and view source. All of the specs are there.

Aren’t familiar with Sol LeWitt or his art? Read this.
Wall Drawing 614: Rectangles formed by 3-inch (8 cm) wide India ink bands, meeting at right angles.
Here is a preview:

Open my D3 implementation of Wall Drawing 614 in a new window →
It is also available as a block.
d3.treemap().d3.treemapBinary. I liked the look of it the best.So much of implementing these drawings with D3.js rely on making a solid, usable data set to join elements with. (After all, D3 stands for data-driven-documents.) Creating these data sets is where I spend most of my time. Once I’ve created them, everything else follows pretty quickly. Here is the function that creates the underlying data set on this piece. I owe major props to Eric Davis on helping me figure this out. I was getting close, but nothing I made was accepted by treemap(). He helped me identify my issues, which included making this data set and then passing it to d3.hierarchy before passing it to treemap.
function getRandomArbitrary(min, max) { return Math.random() * (max - min) + min; } function treeData() { var obj = {name: "rect"}; var children = []; for (var row = 0; row < 40; row++) { children.push({id: row, value: getRandomArbitrary(60, 1000)}) } obj['children'] = children; return obj; }One of the difficulties of D3.js transitioning from v3 to v4 recently is that most of the tutorials you can find on the web no longer work. Thankfully Mike Bostock created a great example of a treemap with v4 that I referenced quite a bit.
After a few passes through the documentation and a call on my friend Eric Davis, we figured out how to pass data to d3.treemap():
d3.hierarchy.sum() on d3.hierarchy and sum the values before passing it to treemaptreemapSee below:
var width = window.innerWidth + 30, height = window.innerHeight + 30; var format = d3.format(",d"); var treemap = d3.treemap() .size([width, height]) .padding(15) .round(true) .tile(d3.treemapBinary); var tree = d3.hierarchy(tree); tree.sum(function(d) { return d.value; }); // always log for debugging! console.log(tree); treemap(tree); d3.select("body") .selectAll(".node") .data(tree.leaves()) .enter().append("div") .attr("class", "node") .attr("title", function(d) { return d.data.id; }) .style("left", function(d) { return d.x0 + "px"; }) .style("top", function(d) { return d.y0 + "px"; }) .style("width", function(d) { return d.x1 - d.x0 + "px"; }) .style("height", function(d) { return d.y1 - d.y0 + "px"; }) .style("background", "#fff");When you resize the screen, the divs gets destroyed and then rebuilt based on the new screen size. Here is the function I use to handle that. It is the same thing I used on 86 and on my Jekyll posts heatmap calendar. I wrapped the D3 instructions in its own function, called that function on first load, then wrote a function to destroy the node divs when the screen is resized and reexecute the D3 instructions after the screen resize ends. I’m sure it can be done with regular javascript, but jQuery makes this kind of thing fast and easy:
// run on first load sol614(); $(window).resize(function() { if(this.resizeTO) clearTimeout(this.resizeTO); this.resizeTO = setTimeout(function() { $(this).trigger('resizeEnd'); }, 500); }); //resize on resizeEnd function $(window).bind('resizeEnd', function() { d3.selectAll("div.node").remove(); sol614(); });Want to dig in a little further? Check out my implementation and view source. All of the specs are there.
Detail shot of the version on display at MASSMoCA:

Another shot of the version on display at MASSMoCA:

If you like this, I also made a version that you can customize. Check it out.

Aren’t familiar with Sol LeWitt or his art? Read this.
Wall Drawing 289: A 6-inch (15 cm) grid covering each of the four black walls. White lines to points on the grids. Fourth wall: twenty-four lines from the center, twelve lines from the midpoint of each of the sides, twelve lines from each corner. (The length of the lines and their placement are determined by the drafter.)
Here is a gfycat preview:
Open my D3 implementation of Wall Drawing 289 in a new window →
It is also available as a block.
So much of implementing these drawings with D3.js rely on making a solid, usable data set to join elements with. (After all, D3 stands for data-driven-documents.) Creating these data sets is where I spend most of my time. Once I’ve created them, everything else follows pretty quickly. Here is the function I wrote to create the underlying data set on this piece:
function getRandomArbitrary(min, max) { return Math.round(Math.random() * (max - min) + min); } function lineData() { var data = new Array(); var id = 1; var ww = window.innerWidth; var wh = window.innerHeight; var numLines = 12; // iterate for cells/columns inside rows for (var center = 0; center < numLines * 2; center++) { data.push({ id: id, class: "center", x1: ww/2, y1: wh/2, x2: getRandomArbitrary(0, ww), y2: getRandomArbitrary(0, wh) }) id++; } for (var topleft = 0; topleft < numLines; topleft++) { data.push({ id: id, class: "topleft", x1: 0, y1: 0, x2: getRandomArbitrary(0, ww), y2: getRandomArbitrary(0, wh) }) id++; } for (var topright = 0; topright < numLines; topright++) { data.push({ id: id, class: "topright", x1: ww, y1: 0, x2: getRandomArbitrary(0, ww), y2: getRandomArbitrary(0, wh) }) id++; } for (var bottomright = 0; bottomright < numLines; bottomright++) { data.push({ id: id, class: "bottomright", x1: ww, y1: wh, x2: getRandomArbitrary(0, ww), y2: getRandomArbitrary(0, wh) }) id++; } for (var bottomleft = 0; bottomleft < numLines; bottomleft++) { data.push({ id: id, class: "bottomleft", x1: 0, y1: wh, x2: getRandomArbitrary(0, ww), y2: getRandomArbitrary(0, wh) }) id++; } for (var middleleft = 0; middleleft < numLines; middleleft++) { data.push({ id: id, class: "middleleft", x1: 0, y1: wh/2, x2: getRandomArbitrary(0, ww), y2: getRandomArbitrary(0, wh) }) id++; } for (var middleright = 0; middleright < numLines; middleright++) { data.push({ id: id, class: "middleright", x1: ww, y1: wh/2, x2: getRandomArbitrary(0, ww), y2: getRandomArbitrary(0, wh) }) id++; } for (var middletop = 0; middletop < numLines; middletop++) { data.push({ id: id, class: "middletop", x1: ww/2, y1: 0, x2: getRandomArbitrary(0, ww), y2: getRandomArbitrary(0, wh) }) id++; } for (var middlebottom = 0; middlebottom < numLines; middlebottom++) { data.push({ id: id, class: "middlebottom", x1: ww/2, y1: wh, x2: getRandomArbitrary(0, ww), y2: getRandomArbitrary(0, wh) }) id++; } return data; } I handled the transition by first defining the lines as starting and ending at the same set of coordinates, then doing a delayed transition to their real end points:
var line = svg.selectAll(".rand") .data(lineData) .enter().append('line') .attr("class", function(d) { return d.class; }) .attr("id", function(d) { return d.id; }) .attr("x1", function(d) { return d.x1; } ) .attr("y1", function(d) { return d.y1; }) .attr("x2", function(d) { return d.x1; } ) .attr("y2", function(d) { return d.y1; }).transition().duration(3000) .attr("x2", function(d) { return d.x2; }) .attr("y2", function(d) { return d.y2; });When you resize the screen, the svg gets destroyed and then rebuilt based on the new screen size. New midpoints are calculated and new ending points for each other lines are calculated. Here is the function I use to handle that. It is the same thing I used on 86 and on my Jekyll posts heatmap calendar. I wrapped the D3 instructions in its own function, called that function on first load, then wrote a function to destroy the svg when the screen is resized and reexecute the D3 instructions after the screen resize ends. I’m sure it can be done with regular javascript, but jQuery makes this kind of thing fast and easy:
// run on first load sol289(); $(window).resize(function() { if(this.resizeTO) clearTimeout(this.resizeTO); this.resizeTO = setTimeout(function() { $(this).trigger('resizeEnd'); }, 500); }); //resize on resizeEnd function $(window).bind('resizeEnd', function() { d3.selectAll("svg").remove(); sol289(); });Want to dig in a little further? Check out my implementation and view source. All of the specs are there.
Detail shot of the version on display at MASSMoCA: 

Arenât familiar with Sol LeWitt or his art? Read this.
Wall Drawing 86: Ten thousand lines about 10 inches (25 cm) long, covering the wall evenly.
Here is a gfycat preview:
Open my D3 implementation of Wall Drawing 86 in a new window â
It is also available as a block.
100*sqrt(2)).Making equal length line segments turned out to be a little more difficult than I anticipated. Lines are drawn by picking two sets of (x,y) coordinates and connecting them. If you leave this 100% random, youâll get lines of all different lengths and slopes. If you want lines of equal lengths and different slopes, however, you need to be a little more crafty.
I came up with two ways of doing it: 1) Pick a random slope and fixed length, then solve a series of rearranged quadratic equations derived from the point-slope form of a line and the distance formulaArchived Link. 2) Derive the second set of coordinates based off of a fixed formula with the first coordinates. This will result in lines having all the same slope initially. Then apply a transform to rotate the lines about their midpoints by a random angle.
Number two was faster and simpler for me to implement, so I went that route.
So much of implementing these drawings with D3.js rely on making a solid, usable data set to join elements with. (After all, D3 stands for data-driven-documents.) Creating these data sets is where I spend most of my time. Once Iâve created them, everything else follows pretty quickly. Here is the function I wrote to create the underlying data set on this piece:
function lineData() { function getRandomArbitrary(min, max) { return Math.random() * (max - min) + min; } var data = new Array(); var id = 1; var ww = window.innerWidth; // Width of the window viewing area var wh = window.innerHeight; // Height of the window viewing area // iterate for cells/columns inside rows for (var line = 0; line 1000; line++) { // 1000 lines var x1 = getRandomArbitrary(-100, ww); // initial points can start 100px off the screen to make even distribution work var y1 = getRandomArbitrary(-100, wh); data.push({ id: id, // For identification and debugging x1: x1, y1: y1, x2: x1 + 100, // Move 100 to the right y2: y1 + 100, // Move 100 up rotate: getRandomArbitrary(0, 360) // Pick a random angle between 0 and 360 }) id++; // Increment the ID } return data; } To make the rotation work without affecting the even distribution of the lines, I needed to rotate them around their midpoints. Otherwise theyâd be rotated around (0,0), which puts lines out of the viewing area at large angles. I essentially used the midpoint formula to calculate the midpoints. I simplified since I know the length of each line. Here is the tranform attribute I applied:
.attr("transform", function(d) { return "rotate(" + d.rotate + " " + (d.x1 + 50) + " " + (d.y1 + 50) + ")";})I handled the transition by first defining the lines as starting and ending at the same set of coordinates, then doing a delayed transition to their real end points. I applied the rotation before the transition so that the lines would appear to grow, but not rotate. To create the effect of the lines being drawn one by one in real-time, I added a delay function with an index. With a 20 millisecond delay and 1000 lines, it takes about 20 seconds to complete:
var line = svg.selectAll("line") .data(lineData) .enter().append('line') .attr("id", function(d) { return d.id; }) .attr("x1", function(d) { return d.x1; }) .attr("y1", function(d) { return d.y1; }) .attr("transform", function(d) { return "rotate(" + d.rotate + " " + (d.x1 + 50) + " " + (d.y1 + 50) + ")";}) .attr("x2", function(d) { return d.x1; }) .attr("y2", function(d) { return d.y1; }).transition().delay(function(d,i){ return 20*i; }).duration(750) .attr("x2", function(d) { return d.x2; }) .attr("y2", function(d) { return d.y2; });Want to dig in a little further? Check out my implementation and view source. All of the specs are there.
Detail shot of the version on display at MASSMoCA: 

Aren’t familiar with Sol LeWitt or his art? Read this.
Wall Drawing 87: A square divided horizontally and vertically into four equal parts, each with lines and colors in four directions superimposed progressively.
Since this is so close to 56 (which I’ve already done), I wanted to add an additional element to challenge myself and learn something: Transitions. The difference between the two is the separate color for each line direction, which ended up lending itself to transitions nicely.
Adding the color and transitions into this one made me change my mental model for how I’m building these implementations. I was able to complete the first three I picked (56, 11, and 391) with only four
The solution turned out to solve my mental block for both the colors and the transitions. I started to doodle this drawing in a journal and realized that I did each line direction one whole layer at a time, layering each one on top of the others. Yet, I had been trying to cram all four directions into a single layer here on the web. So, I modified my D3 code to join more
Then, I added a transition() and a delay() to each “layer” so that the viewer can also experience and take notice of the intentional layering of this piece.
There is definitely more I can do with transitions. This is just the beginning for me. I achieved what I wanted with this piece, so I’m going to move on to others and continue exploring and learning how to implement transitions.
Here is an image preview. Click on it to see the D3.js version:

Open my D3 implementation of Wall Drawing 87 in a new window →
It is also available as a block.
Unlike the earlier colored versions that used grey, yellow, red, and blue, this uses Sol Lewitt’s second color palette of choice: grey, yellow, tan, and reddish-brown.
svg element with two groups and 8 rect elements in each group.transition() and delay() functions applied to animate the layers.Detail shot of the version on display at MASSMoCA: 
Wide shot of the version on display at MASSMoCA (Poor lighting): 
On October 13 I ran a data-related workshop for the Praxis community.
I split the talk up into two parts:

Download my slides without my talking notes ↓
Download my slides with my talking notes ↓
Thanks to TK Coleman for asking me to do the worksop and for recording the video!
Here are a few ideas on how Praxis participants can incorporate data analysis and visualization into their PDPs (personal development plans):

Aren’t familiar with Sol LeWitt or his art? Read this.
Wall Drawing 391: Two-part drawing. The two walls are each divided horizontally and vertically into four equal parts. First wall: 12-inch (30 cm) bands of lines in four directions, one direction in each part, drawn in black India ink. Second wall: Same, but with four colors drawn in India ink and color ink washes.
391 is one of the iconic images that people instantly recognize as a Sol LeWitt. After making the simple line drawings, I wanted to try something more comfortable and a little more complex. Now that I’ve created this, I could translate it into #419. Perhaps I will do this in the future.
Here is an image preview. Click on it to see the D3.js version:

Open my D3 implementation of Wall Drawing 391 in a new window →
rect elements in each group (one for each quadrant). The only difference between the left and right SVG squares is the color.sqrt(2) times the size of the vertical one. When I run those calculations and set the diagonal patterns as such, the right one lines up but the left one is shifted too far up. I ended up finding a middle ground, but the stroke size of the bottom ones aren’t exactly 36 pixels wide. They are 37 pixels wide. That is the price I pay for using a library. I’ll learn to write my own SVG patterns in the future.Wide shot of the version on display at MASSMoCA: 

Aren’t familiar with Sol LeWitt or his art? Read this.
Wall Drawing 11: A wall divided horizontally and vertically into four equal parts. Within each part, three of the four kinds of lines are superimposed.
Wall Drawing 11 is remarkably close to Wall Drawing 56, which is the first one I implemented. I discovered that with only a few changes (width, height, and pattern direction) I could turn my code for 56 into 11.

Open my D3 implementation of Wall Drawing 11 in a new window →
D3.js – The D3.js library is well-suited to Sol LeWitt’s early works. D3’s foundational principle of joining data to elements is easy to apply to LeWitt’s symmetrical objects.
Textures.js – I’m using this library to quickly create the background patterns. It plays very well with D3.js, which is why I chose it. It is a great little library that is very easy to use. It has some limitations around the edges, but the alternative is writing my own SVG paths for the patterns, which I didn’t want to do at this time.
Detail shot of the version on display at MASSMoCA: 
Wide shot of the version on display at MASSMoCA: 

Aren’t familiar with Sol LeWitt or his art? Read this.
Wall Drawing 56: A square is divided horizontally and vertically into four equal parts, each with lines in four directions superimposed progressively.
Wall Drawing 56 was the first of Sol LeWitt’s wall drawings I tried to implement here on the web. I picked it for its simplicity: A square with four sets of patterns and two colors. I wasn’t sure exactly what interpreting and implementing these would entail, so I wanted something simple and recognizable at first.

Open my D3 implementation of Wall Drawing 56 in a new window →
D3.js – The D3.js library is well-suited to Sol LeWitt’s early works. D3’s foundational principle of joining data to elements is easy to apply to LeWitt’s symmetrical objects.
Textures.js – I’m using this library to quickly create the background patterns. It plays very well with D3.js, which is why I chose it. It is a great little library that is very easy to use. It has some limitations around the edges, but the alternative is writing my own SVG paths for the patterns, which I didn’t want to do at this time.
rect elements in each group (one for each quadrant).Detail shot of the version on display at MASSMoCA: 
Wide shot of the version on display at MASSMoCA: 