Blog
-
Isaac Morehouse Podcast Episode 75 – How to Learn Anything, with Chuck Grimmett

-
Ember.js Basics

Resources
What it is
- Ember.js is an open-source Javascript framework with the Model–view–viewmodel pattern.
- Ember is an opinionated framework. This means that most architectural design decisions have been made for you by the developers of the framework. The advantage of this is that anyone who knows Ember can load your code and understand within a few minutes what is going on.
Core Concepts
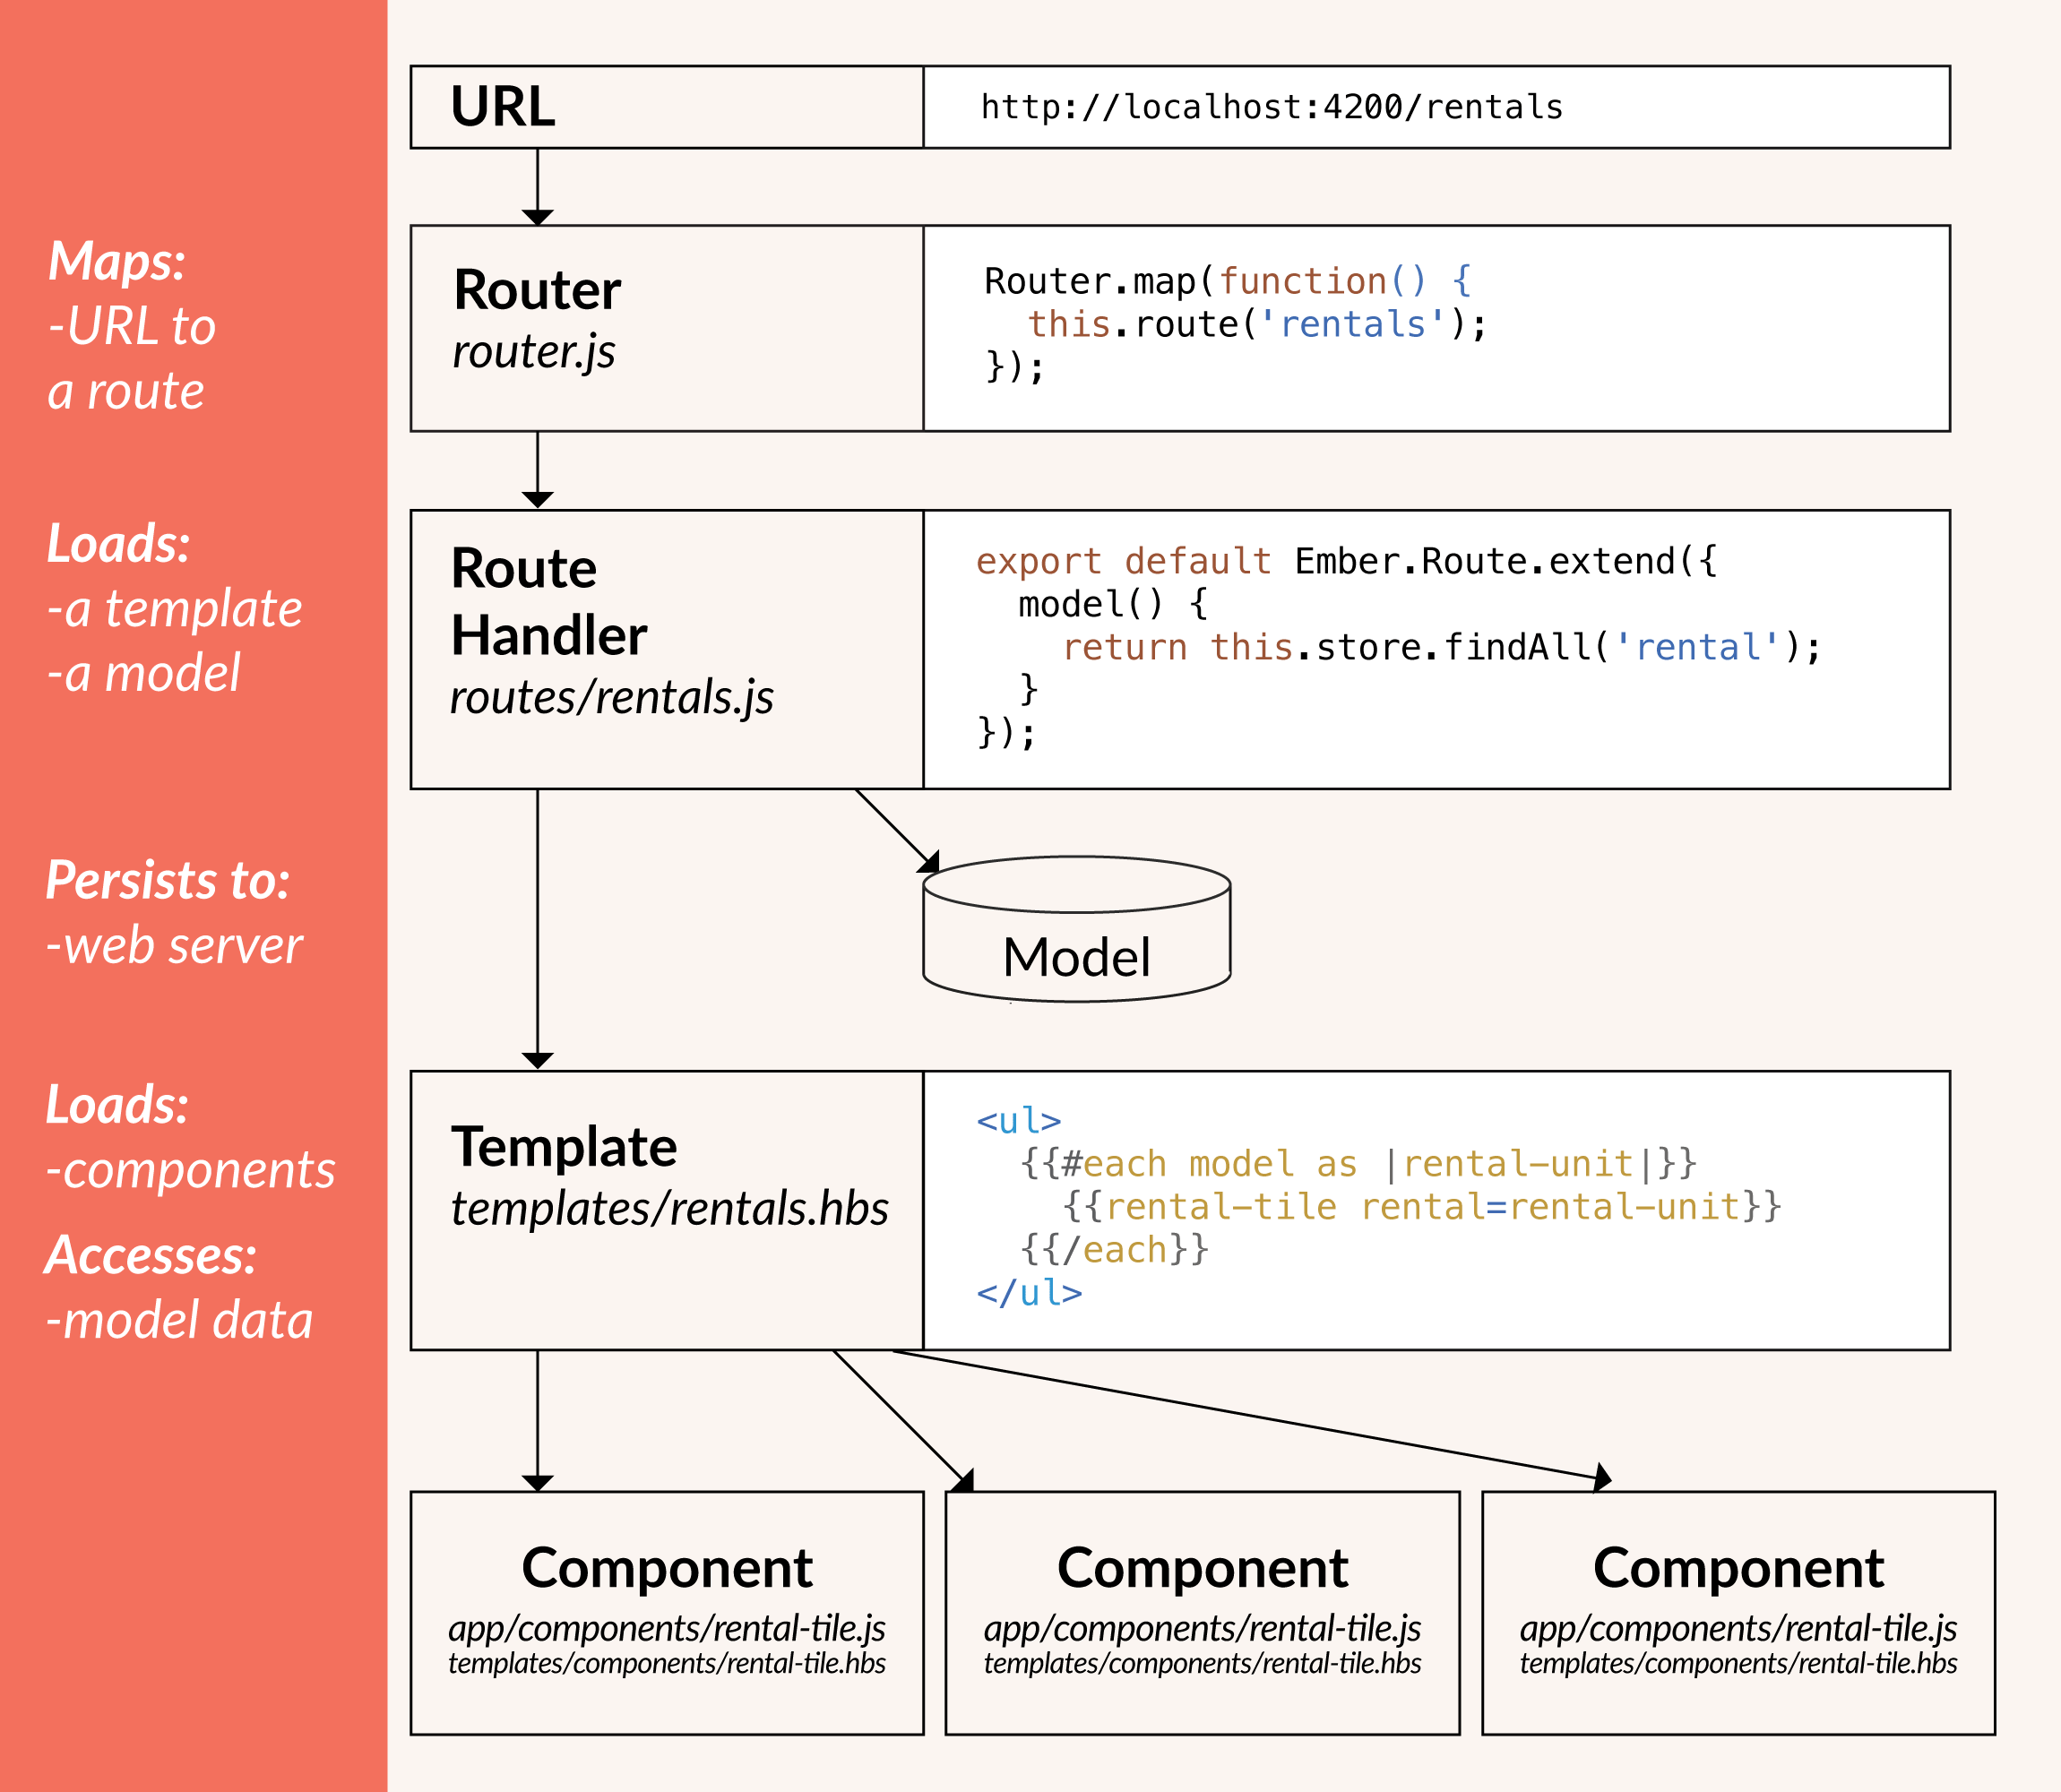
- Ember router maps a URL to a route handler
- Route handler renders a template, then a model that is available to the template. Templates use Handlebars syntax.
- Models save data in a “persistent state”, which is fancy language for putting it in a database or data store of some kind.
- Components control how the UI behaves. They have two parts: A handlebars template and a javascript source file that defines the behavior.
Installing and running a project
Install:
$ npm install -g ember-cli@2.6Creating a new app:
$ ember newStarting the development server. You must be in the project folder (
cdto it). It will serve on http://localhost:4200/$ ember serveror
ember sfor short -
Link Posts with Jekyll

Today I learned:
How to make link posts (or external post links) with Jekyll
I’m an avid reader of Marco.org and Daring Fireball. They both have these nifty posts that link directly to external pages. Now that I have two blogs, a podcast, and occasionally have work published elsewhere, I want to keep a record of these things on my cagrimmett.com blog. Link posts are an excellent way to do that.
Jekyll doesn’t have this capability out of the box, but with a little Liquid magic you can make it happen. I followed Christian-Frederik Voigt’s method. This takes advantage of the ability to create items in each post’s YAML front-matter and use them in template files:
First, create a variable called
link:in your YAML front-matter for the post you want to link elsewhere. Fill it in with the link you want to post to link to:--- layout: post title: Snack Time Episode 3 - Negroni Week date: 2016-06-09 feature-img: "/img/snacktime-pattern.png" excerpt: blah blah blah excerpt here link: http://snacktime.fm/episodes/2016/6/9/episode-3-negroni-week ---Then anywhere in the template files that generates post headlines, you’ll need to write a conditional to check if the new
link:variable is present. If it is, you’ll want to write the headline’s link there (post.link) instead of thepost.url. I also added an arrow inside another conditional to specify that this is an outgoing link:{% if post.link %}{{ post.link }}{% else %}{{ post.url }}{% endif %}">{{ post.title }}{% if post.link %} →{% endif %}You’ll want to use this anywhere your posts are listed. For me that is in
index.htmland404.html.See this in action on my homepage.
This method works great if you want to have direct links to other places and don’t want a permalink page on your own site that you can reference. I don’t care about that, so I didn’t make this for my site. If you want that, you’ll need to refer to Christian-Frederik Voigt’s method. The short story is that you’ll also need to modify the post and page templates.
-
Snack Time Episode 3 – Negroni Week

-
Counting and JSON output in Jekyll

Today I learned:
Jekyll has a built-in filter called
jsonifyto turn data into JSON and Liquid has a filter calledjson. These is pretty useful for turning standard Jekyll output arrays into JSON, but if you need something more customized, you’ll need to build it yourself because Liquid’s ability to create arrays is limited. (Not a criticism, just an observation. It is primarily a templating language.)For example, I wanted to store the dates I have blog posts for and the number of posts on each of those dates in order to pass it to a heatmap calendar. I couldn’t figure out a way to build that into a single array with Liquid (and I didn’t want to drop down into Ruby), so I figured out a way build JSON manually.
This outputs my blog’s post dates in the Unix timestamp format and displays the number of posts on a given day and leaves the trailing comma off to comply with the JSON standard:
{% assign counter = 0 %}{ {% for post in site.posts %}{% capture day %}{{ post.date | date: '%s' }}{% endcapture %}{% capture prevday %}{{ post.previous.date | date: '%s' }}{% endcapture %}{% assign counter = counter | plus: 1 %}{% if day != prevday %}"{{ post.date | date: '%s' }}": {{ counter }}{% assign counter = 0 %}{% if forloop.last == false %},{% endif %} {% endif %}{% endfor %}}Output:
{ "1463716800": 1, "1463371200": 1, "1462593600": 2, "1462507200": 1, "1462248000": 1, "1462161600": 1, "1461643200": 1, "1461297600": 3, "1461124800": 1, "1460952000": 1, "1460606400": 1, "1460347200": 1, "1459915200": 1, "1458792000": 1, "1458705600": 1, "1458619200": 1, "1458532800": 1, "1458446400": 1, "1458273600": 2, "1457586000": 1, "1457499600": 1, "1457413200": 1, "1457326800": 1, "1457240400": 1, "1456981200": 1, "1456894800": 1, "1456808400": 1, "1456722000": 1, "1456376400": 1, "1456290000": 1, "1456203600": 1, "1456117200": 1, "1456030800": 1, "1455944400": 1, "1455858000": 1, "1455771600": 2, "1455685200": 1, "1455598800": 1, "1455512400": 1, "1455339600": 1, "1455253200": 1, "1455166800": 1, "1455080400": 1, "1449032400": 1, "1441944000": 1, "1441598400": 1, "1441166400": 1, "1416978000": 1, "1377662400": 1 }The key to getting the counts right was advancing the counter by 1, comparing the date of the current post to the previous post, outputting the date and the count if they did not match, and if they did match advancing the counter by 1 and comparing again. After the date and count are output, the counter is reset to 0.
You can see the heatmap calendar on my TIL page.
Thanks to Eric Davis for advice on using less code and pointing out how I can make the trailing comma if statement more efficient:
%if forloop.last == false% , %endif%He said:
If there’s one bit of “programming advice” I would give to anybody mucking around with this stuff, it’s this: Write as little code as humanly possible. The most bug-free line of code is the line not written.
What I need to ask myself: If something is being repeated, why?
-
Photo Metadata Analysis Project
I’m working my way through some data science and visualization books right now. I found that I learn better by doing small projects than I do by copying examples in books, so I designed a little project to apply some of what I learned and to learn some new skills along the way.
My goal was to make a project where I do everything from start to finish: Create my own data set, format it, analyze it, then visualize it. I also wanted to make it fairly common and as automated as possible so it could be repeated by others.
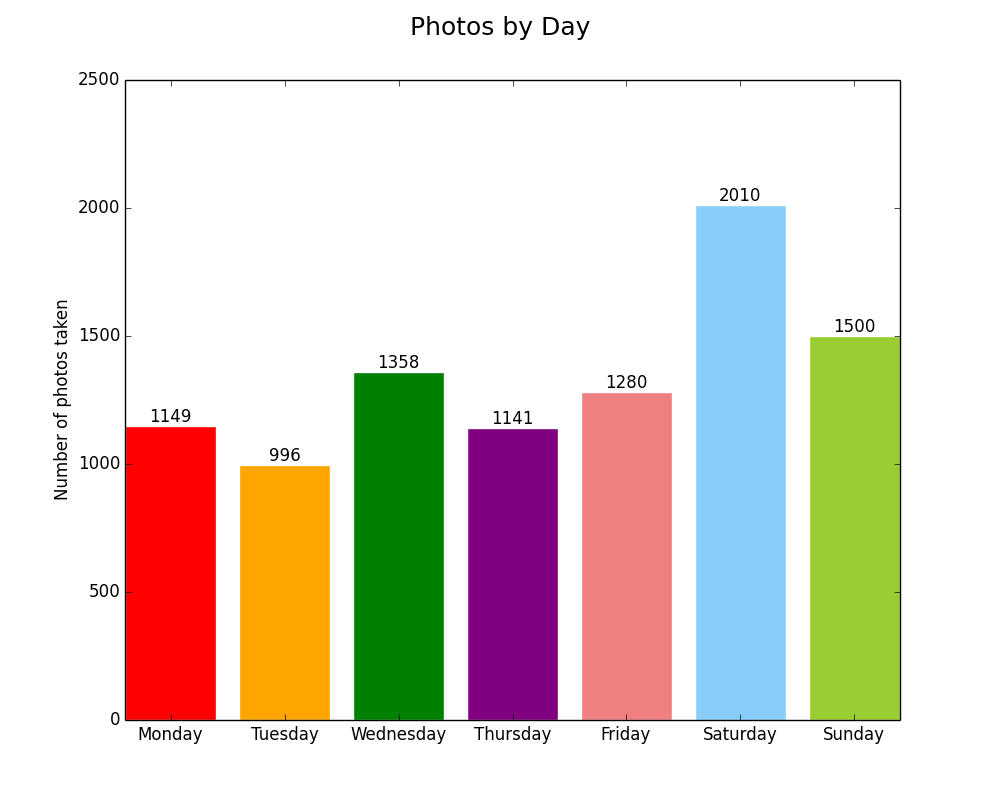
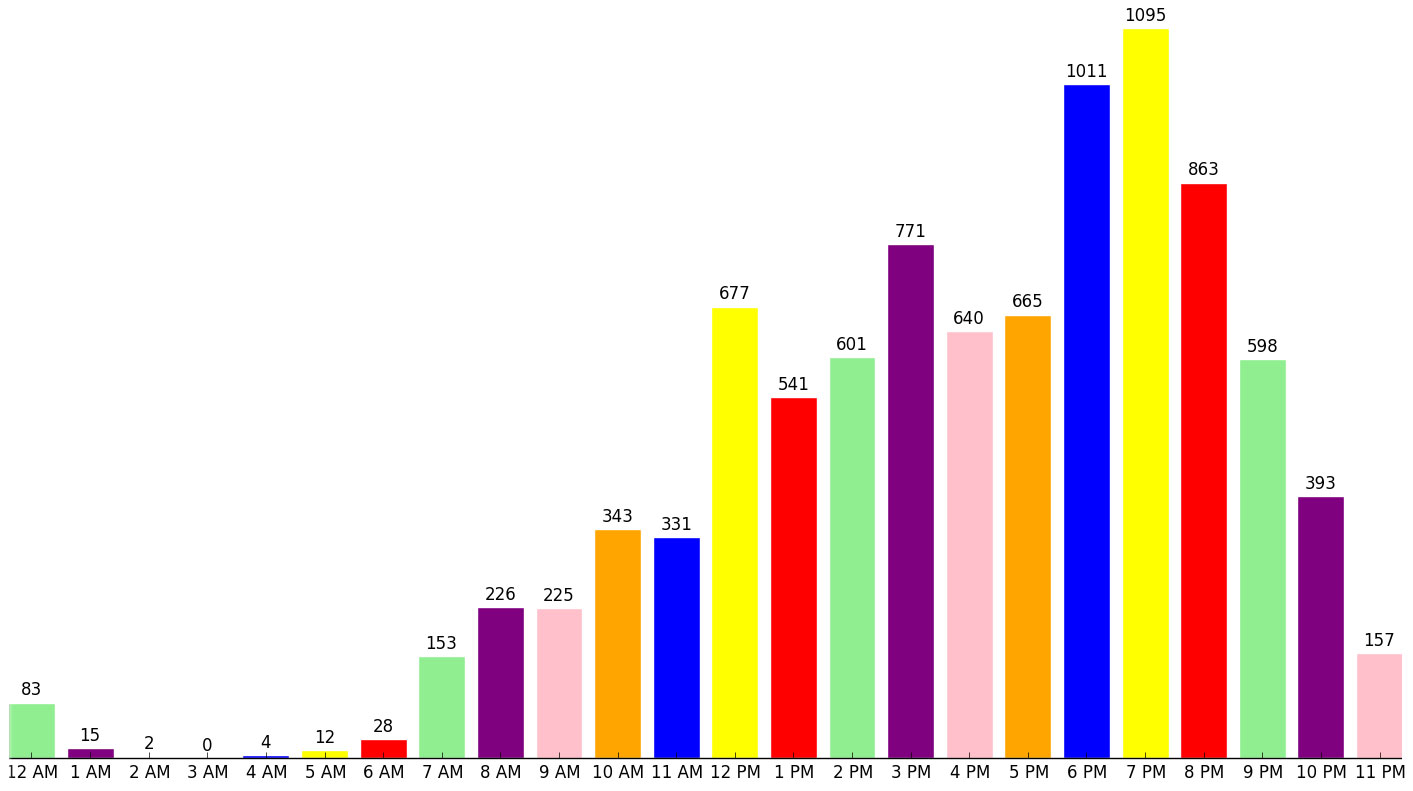
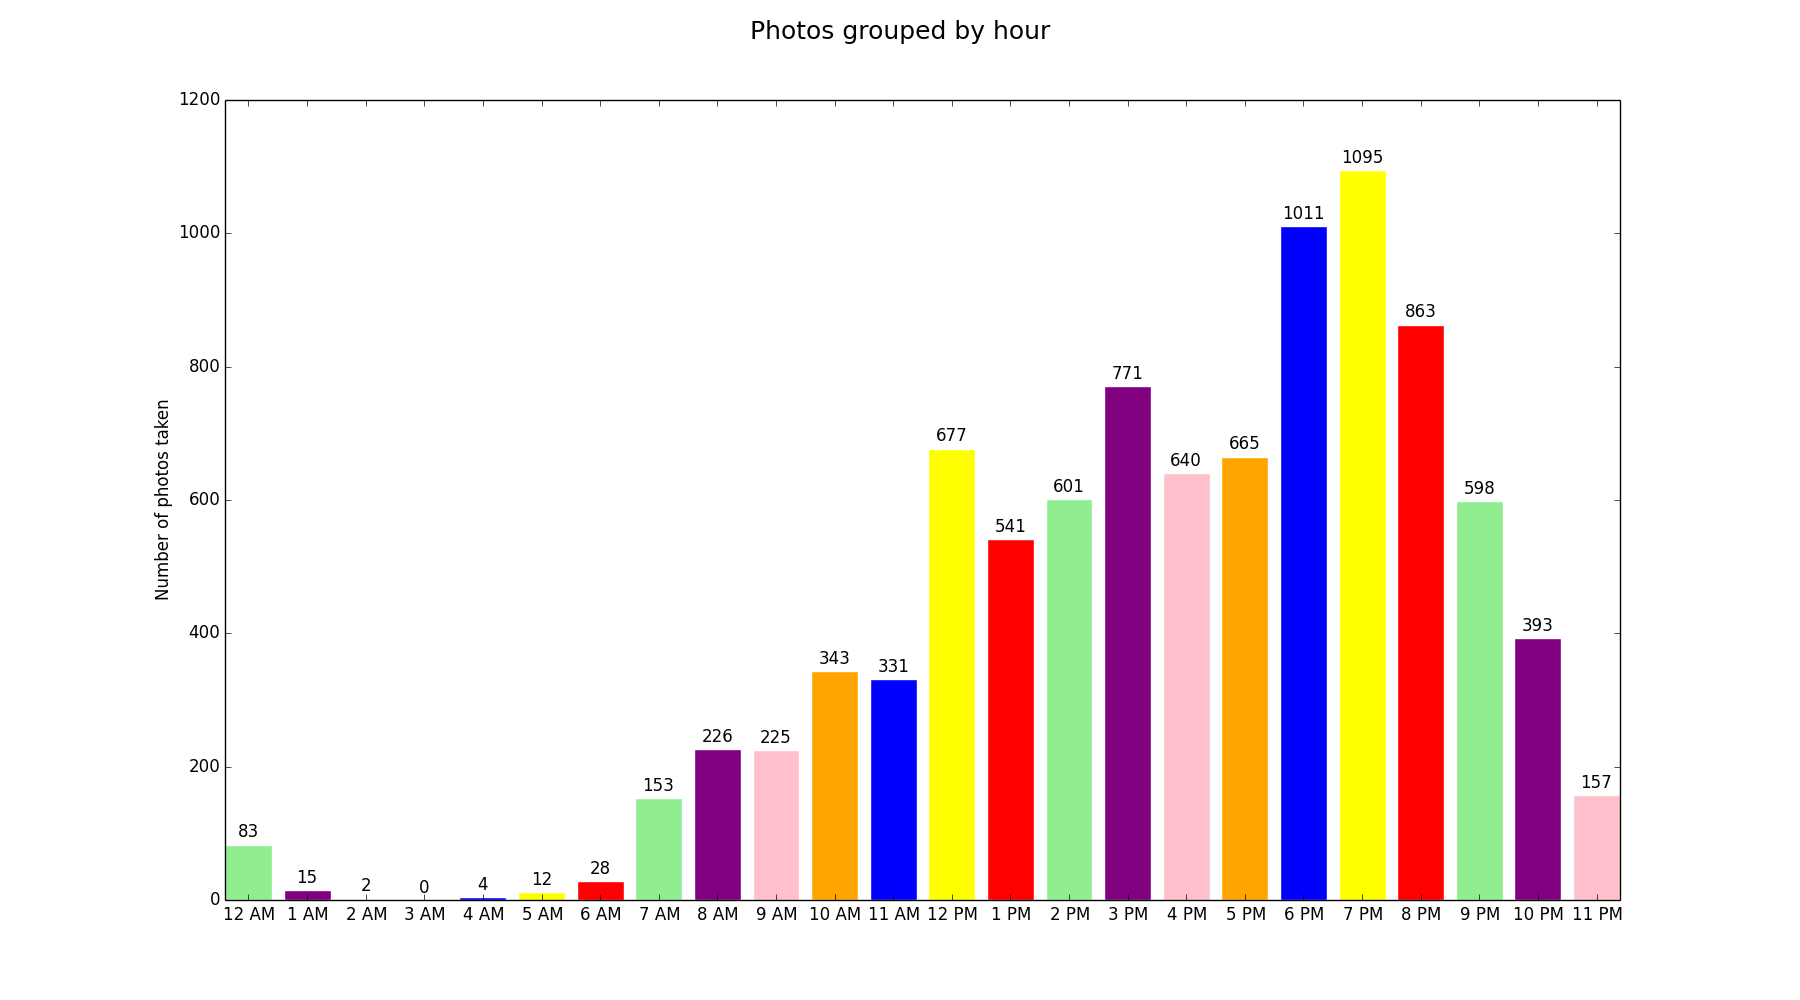
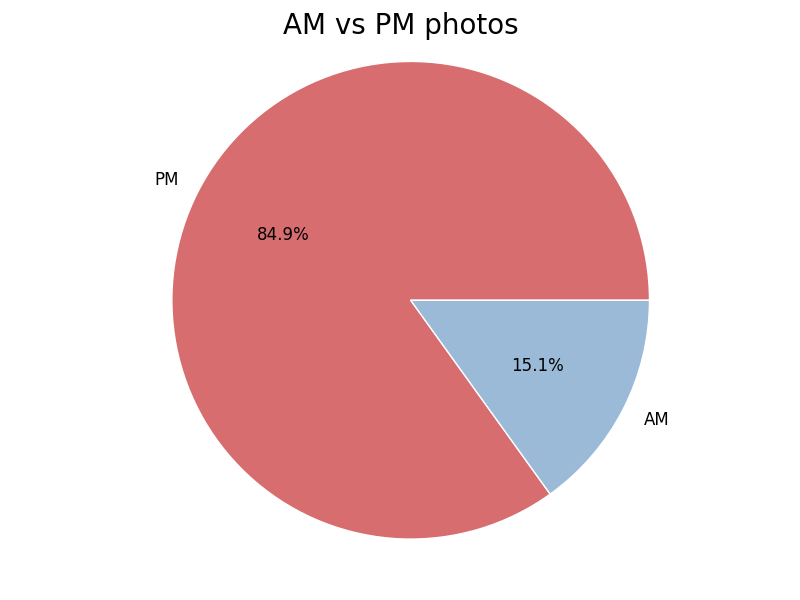
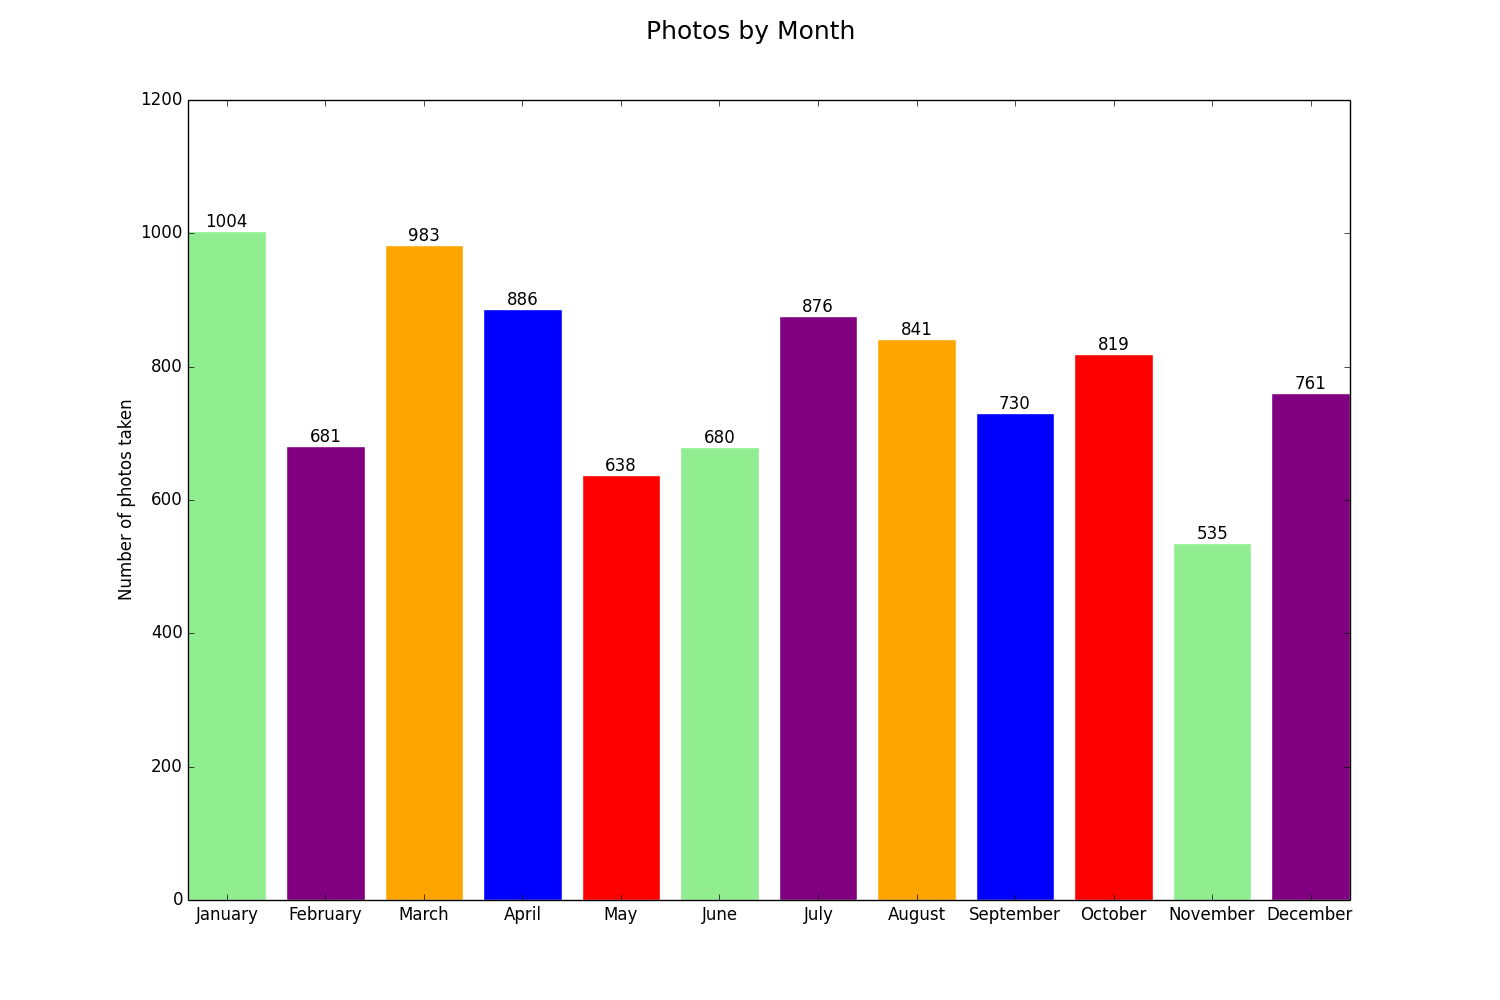
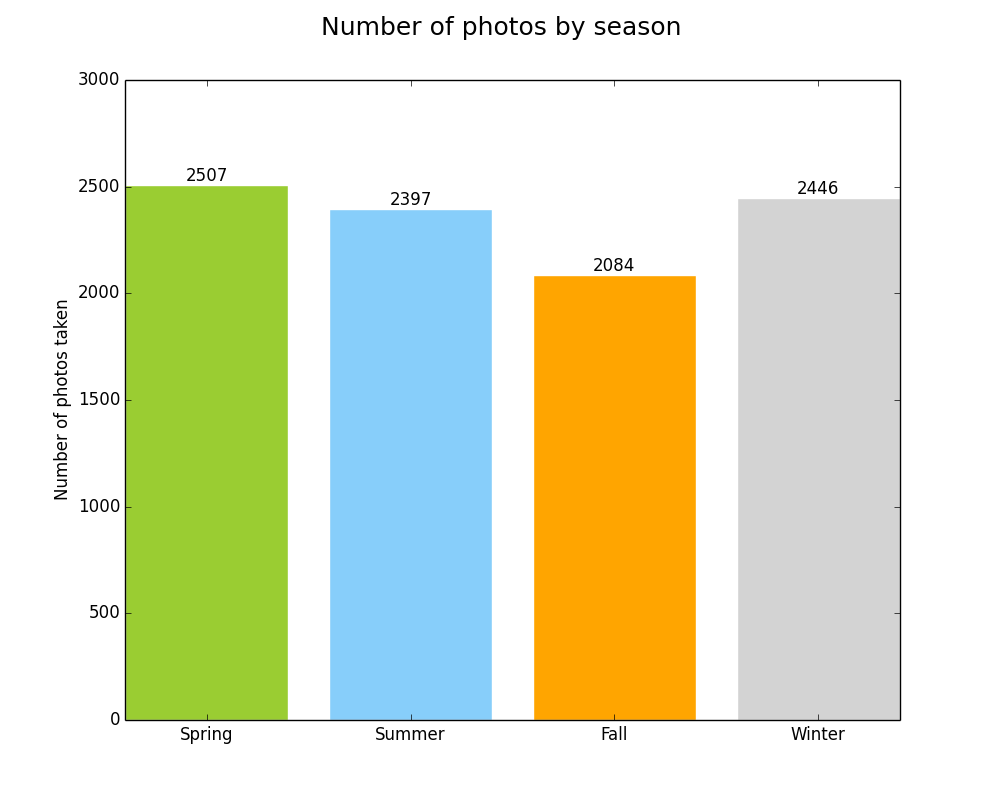
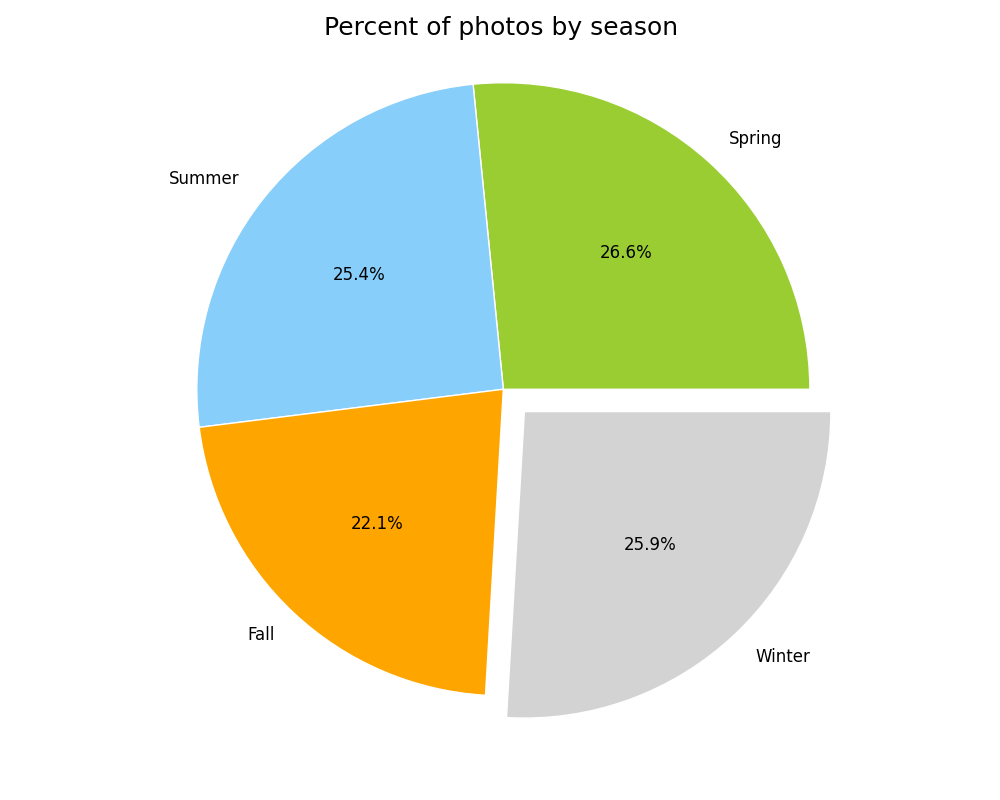
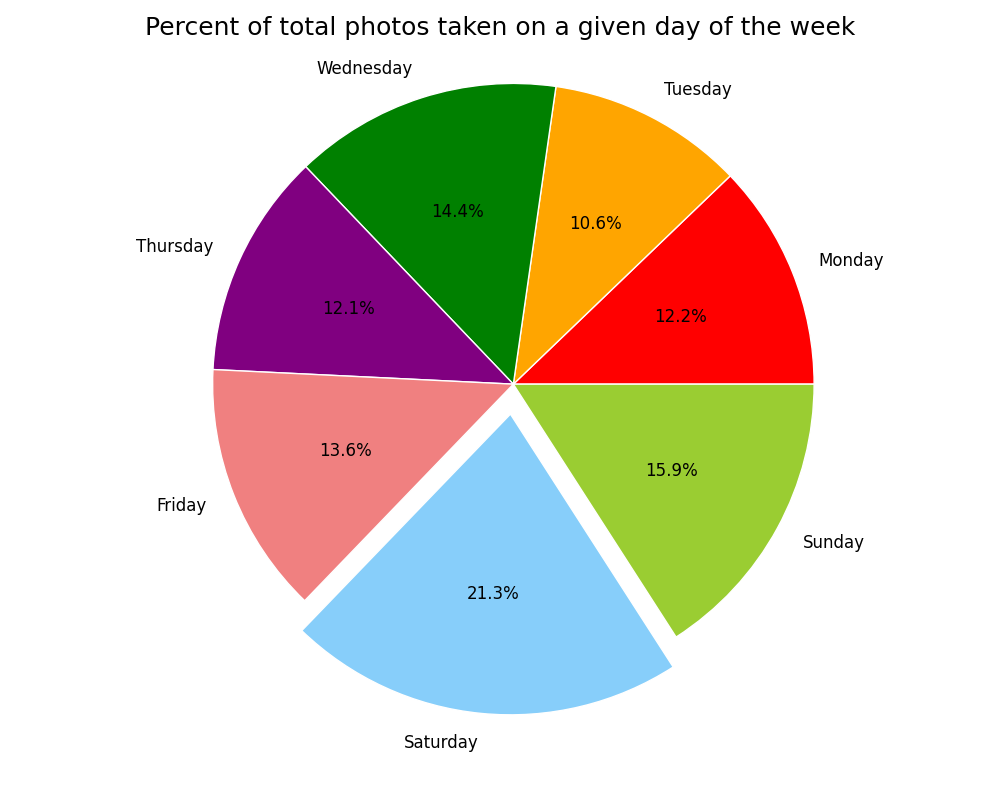
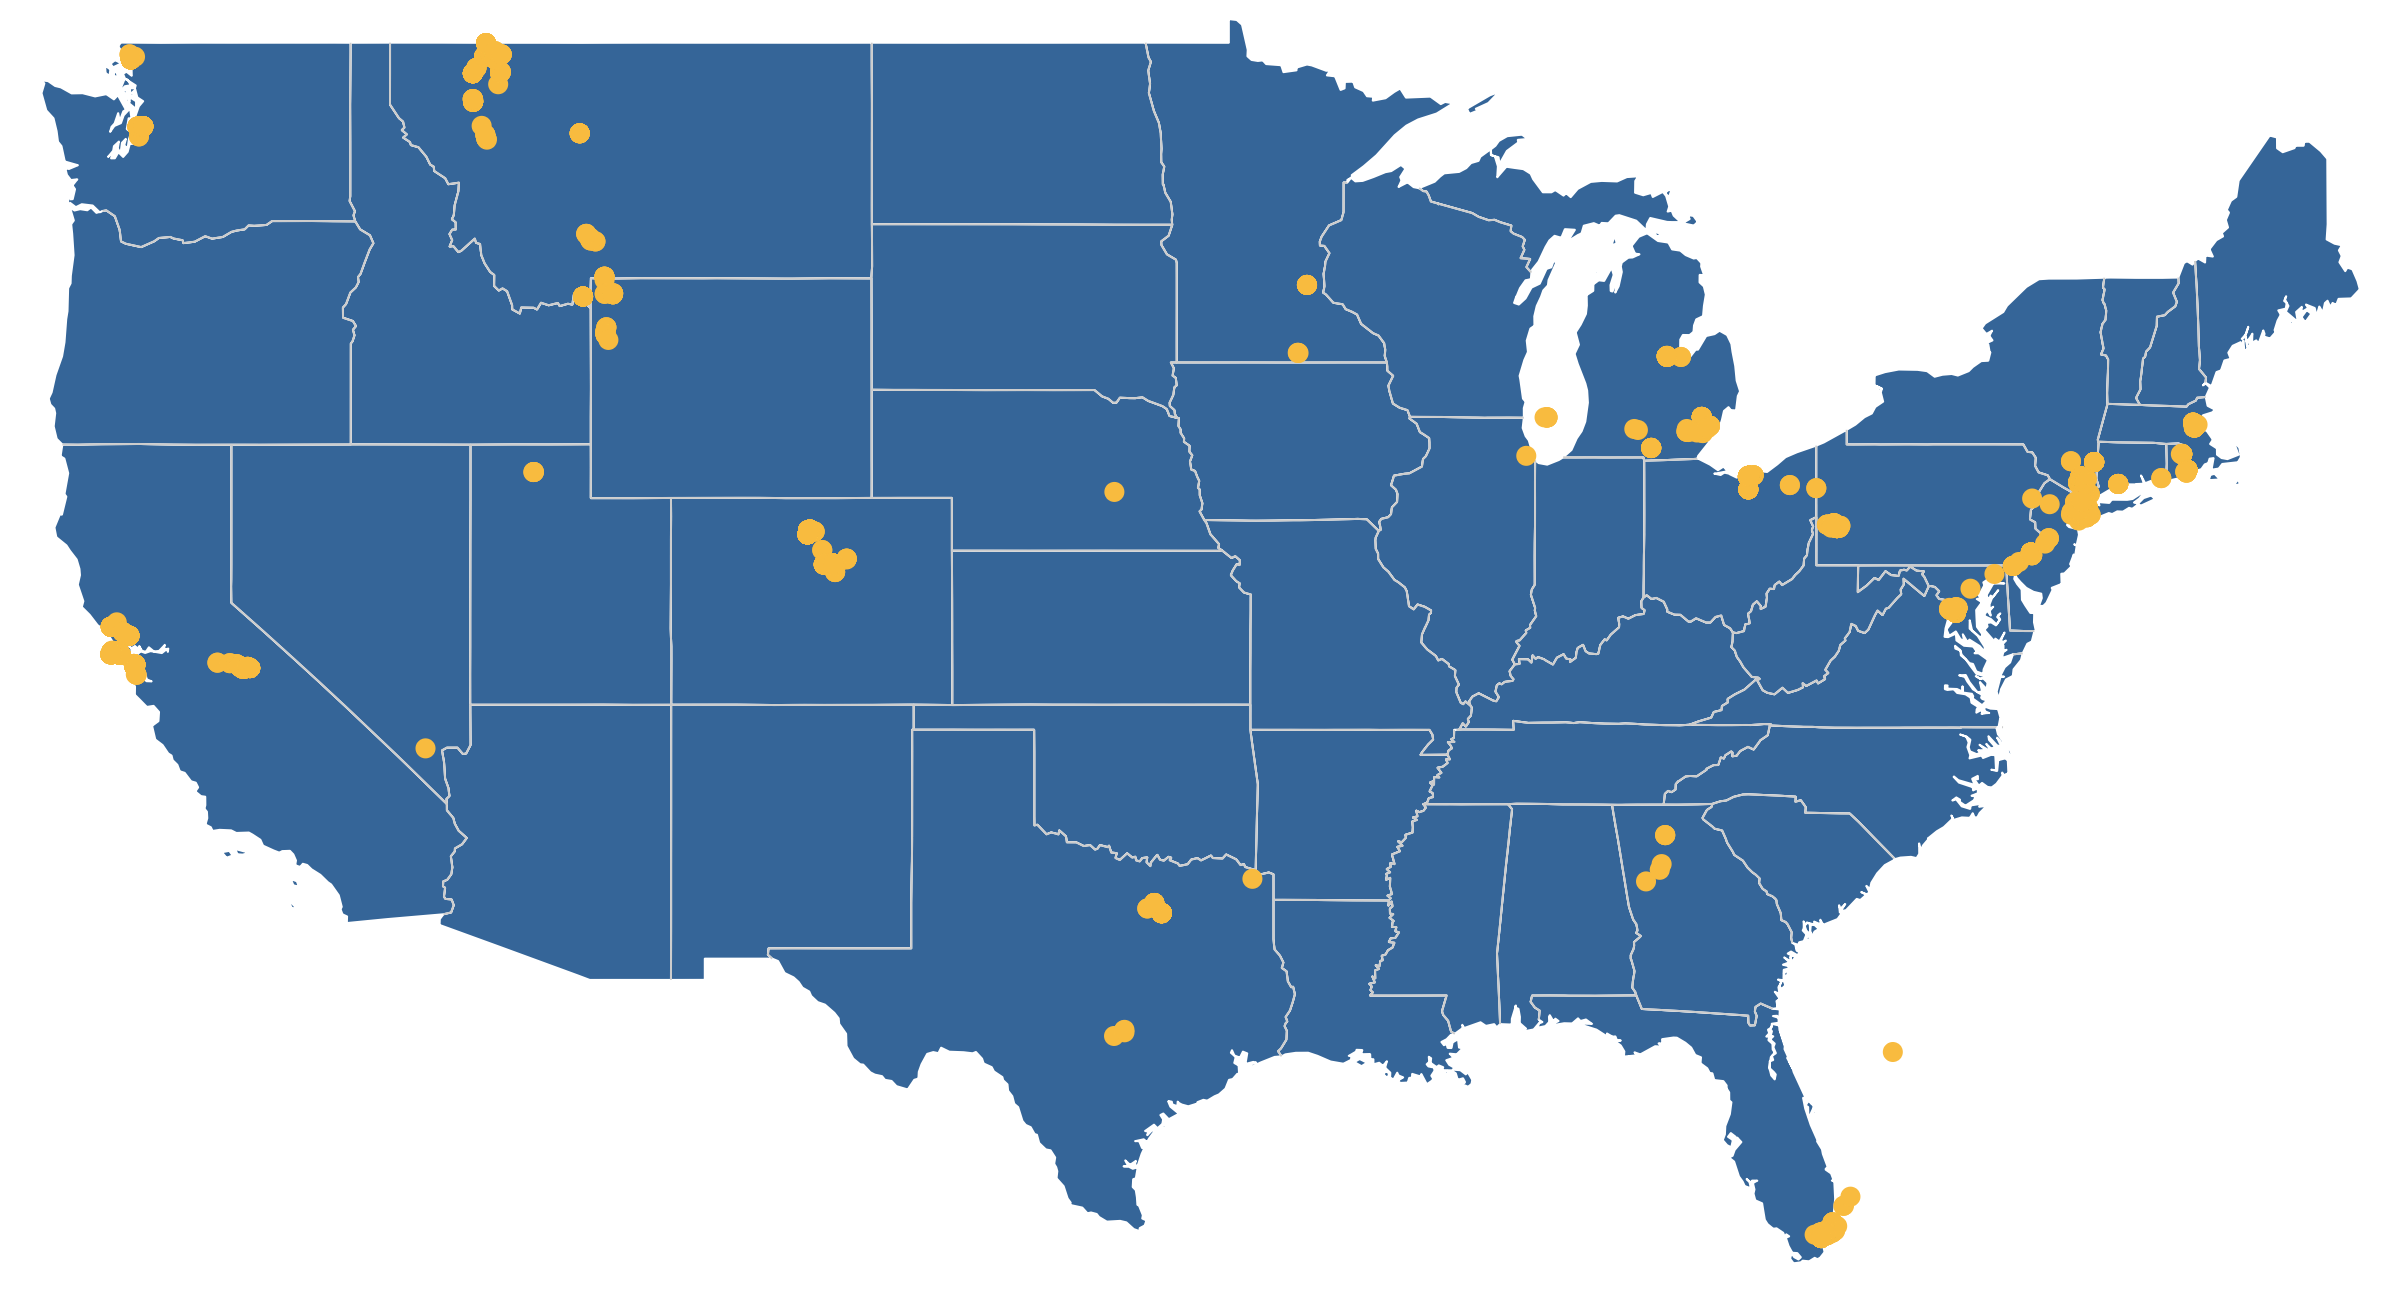
Here is what I came up with: Extracting metadata from my iPhone photos, analyzing it in different ways (days, months, hours, seasons), and visualizing it. I used free tools to do the extraction, formatting, and visualization, then scripted everything with AppleScript and Python to automate it.
Technical Details
You can find the full repository on GitHub. If you have a recent Mac with Photos.app and TextWrangler, you can run the scripts and produce your own charts!
- I used AppleScript to loop through photo metadata in Photos.app and write it out to a CSV files that it creates in the same directory as the scripts.
- I used TextWrangler’s grep functionality via AppleScript to break apart the date strings into days of the week, dates, and times, and to remove bad or null location strings (lat,long). I know I could have written this in Python, but I didn’t want to reinvent the wheel. TextWrangler’s AppleScript library is very powerful and easy to use.
- Python was my tool of choice for analyzing the CSV files in various ways and visualizing the results with one of its plotting libraries, matplotlib.
- The map of where photos were taken in the US was generated with D3.js.
- Once everything has been generated and saved, AppleScript opens the images in Preview and launches a simple Python webserver to show the map.
The Results

Lessons
- I really beefed up my understanding of basic Python (with help from Eric Davis!)
- I dusted off my AppleScript knowledge and gave it a workout. I learned that AppleScript has a concept of lists that you can pass into and out of programs. This was the key to launching all of the charts in a single preview window.
- This was a great exercise in UX. How can this be both easy to use and easy to interpret?
- This was an exercise in thinking programatically. How can this be built in a way that makes it reusable?
- I learned how to project location information onto a map with D3.js. I’ve used D3.js for charts before, so this was a good way to expand my skills.
- This was a good way to practice my git skills and think through how to structure a project and make executable code.
- There is a lot more I can add to this (more mapping options, more ways to count the photos, outputting the photos in a calendar heatmap), but I feel comfortable stopping and moving on because I learned what I wanted to from it and I’m ready to start a new project. I might come back to this in the future and I might not, but either way I’m happy with this.
Cavaets
- This analysis is not scientific, it was for fun. Since my photos were taken with different cell phones across non-controlled time periods, I can’t use this analysis to say things like, “I’m more likely to take photos in the spring than the fall.” The truth is that there are photos in here from three springs but only two falls.
- I can’t guarantee that my code will work for everyone. It is still a little buggy and hasn’t been tested for all scenarios. I know this and know how I would test it, but this project isn’t big enough to warrant it.
- The color palettes I used aren’t bulletproof. If you use F.lux or Night Shift the yellows will blend in to the screen, and if you have visual impairments you might not be able to distinguish between the greens and blues.
Try it for yourself
You can download the repository from GitHub and run it against your Photos.app library. The requirements and instructions are in the README. Let me know if you have any issues and I’ll do my best to help you out.
-
Glacier National Park

Last year Amanda and I went to Montana for a week in early May. We started in Yellowstone and then went up to Glacier. It was before the official start of the season and Going to the Sun Road was still closed, but we avoided the crowds, explored the park in solitude, took in the wonderful scenery, and ran into some incredible wildlife.
Here is the best of what I shot over three days in Glacier.


-
Identifying and killing background Python processes

Today I learned:
How to kill rogue background Python processes
I started a simple Python http server as a background process at the end of a Python script. That was a mistake. Since it isn’t running in an open Terminal window, it is easy to forget about and it will run until you kill the process or reboot your machine. I don’t like that.
Here is how to identify and kill background Python processes in Terminal.app:
Run:
ps -elf | grep pythonThis will return something like this:
501 74440 74439 4004 0 31 0 2505592 9276 - S 0 ?? 0:00.29 python -m Simple 8:43AM 501 77045 77016 4006 0 31 0 2436888 812 - S+ 0 ttys000 0:00.00 grep python 8:57AMThe second column is the PID. Make note of which one you want to kill. Then run:
kill -9 PIDExample. Let’s say I want to kill the
python -m SimpleHTTPServerprocess. I see that its PID is 74440. So I would run:kill -9 74440 -
Simple HTTP server with Python

Today I learned:
Simple HTTP server
Need to quickly test how something works/functions but don’t want to go through the hassle of putting it on a webserver? Python has you covered.
$ cd /home/some/dir $ python -m SimpleHTTPServerThen you can access the stuff in that directory it via http://localhost:8000/ in your browser!
Control + cstops it. -
Regex Lookahead and Lookbehind

Today I learned:
Regex Lookahead and Lookbehind
(?=foo)Lookahead Asserts that what immediately follows the current position in the string is foo (?<=foo)Lookbehind Asserts that what immediately precedes the current position in the string is foo (?!foo)Negative Lookahead Asserts that what immediately follows the current position in the string is not foo (?Negative Lookbehind Asserts that what immediately precedes the current position in the string is not foo Example
Expression:
Hell(?=o)- LookaheadHellishfailsHellopassesMelloHellopasses
Use
The basic example above isn’t very helpful. But it can be very useful for password rule validation or advanced find/replaces.
-
Responsive D3.js bar chart with labels

Today I learned some cool stuff with D3.js!
Here is a minimalist responsive bar chart with quantity labels at the top of each bar and text wrapping of the food labels. It is actually responsive, it doesn’t merely scale the SVG proportionally, it keeps a fixed height and dynamically changes the width.
For simplicity I took the left scale off. All bars are proportional and are labeled anyway.
Go ahead and resize your window! This has a minimum width of about 530px because of the text labels. Any smaller than that and they are very difficult to read.
The basic HTML
<div id ="chartID"></div>
<script type="text/javascript" src="http://d3js.org/d3.v3.min.js"></script>
The Styles
You’ll see that the axis is actually there but it is white. I found it useful to learn to draw it, but I didn’t want it so I am keeping it hidden.
.axis path, .axis line {
    fill: none;
    stroke: #fff;
  }
.axis text {
  	font-size: 13px;
  }
.bar {
    fill: #8CD3DD;
  }
.bar:hover {
    fill: #F56C4E;
  }
svg text.label {
  fill:white;
  font: 15px;
  font-weight: 400;
  text-anchor: middle;
}
#chartID {
	min-width: 531px;
}
The Data
var data = [{"food":"Hotdogs","quantity":24},{"food":"Tacos","quantity":15},{"food":"Pizza","quantity":3},{"food":"Double Quarter Pounders with Cheese","quantity":2},{"food":"Omelets","quantity":30},{"food":"Falafel and Hummus","quantity":21},{"food":"Soylent","quantity":13}]The Javascript Heavy Lifting
This is where D3 really comes in.
- Setting the margins, sizes, and figuring out the basic scale.
- Setting the axes
- Drawing the basic SVG container with the proper size and margins
- Scaling the axes
- Drawing the bars themselves
var margin = {top:10, right:10, bottom:90, left:10};

var width = 960 - margin.left - margin.right;

var height = 500 - margin.top - margin.bottom;

var xScale = d3.scale.ordinal().rangeRoundBands([0, width], .03)

var yScale = d3.scale.linear()
      .range([height, 0]);


var xAxis = d3.svg.axis()
		.scale(xScale)
		.orient("bottom");


var yAxis = d3.svg.axis()
		.scale(yScale)
		.orient("left");

var svgContainer = d3.select("#chartID").append("svg")
		.attr("width", width+margin.left + margin.right)
		.attr("height",height+margin.top + margin.bottom)
		.append("g").attr("class", "container")
		.attr("transform", "translate("+ margin.left +","+ margin.top +")");

xScale.domain(data.map(function(d) { return d.food; }));
yScale.domain([0, d3.max(data, function(d) { return d.quantity; })]);


//xAxis. To put on the top, swap "(height)" with "-5" in the translate() statement. Then you'll have to change the margins above and the x,y attributes in the svgContainer.select('.x.axis') statement inside resize() below.
var xAxis_g = svgContainer.append("g")
		.attr("class", "x axis")
		.attr("transform", "translate(0," + (height) + ")")
		.call(xAxis)
		.selectAll("text");

// Uncomment this block if you want the y axis
/*var yAxis_g = svgContainer.append("g")
		.attr("class", "y axis")
		.call(yAxis)
		.append("text")
		.attr("transform", "rotate(-90)")
		.attr("y", 6).attr("dy", ".71em")
		//.style("text-anchor", "end").text("Number of Applicatons");
*/


	svgContainer.selectAll(".bar")
  		.data(data)
  		.enter()
  		.append("rect")
  		.attr("class", "bar")
  		.attr("x", function(d) { return xScale(d.food); })
  		.attr("width", xScale.rangeBand())
  		.attr("y", function(d) { return yScale(d.quantity); })
  		.attr("height", function(d) { return height - yScale(d.quantity); });
Adding the quantity labels to the top of each bar
This took me a while to figure out because I was originally appending to the
rectelement. According to the SVG specs this is illegal, so I moved on to appending them after everything else to they’d show on top. The positioning is tricky, too. I eventually found the correct variables to position it close to center. Thentext-anchor: middle;sealed the deal.// Controls the text labels at the top of each bar. Partially repeated in the resize() function below for responsiveness. svgContainer.selectAll(".text") .data(data) .enter() .append("text") .attr("class","label") .attr("x", (function(d) { return xScale(d.food) + xScale.rangeBand() / 2 ; } )) .attr("y", function(d) { return yScale(d.quantity) + 1; }) .attr("dy", ".75em") .text(function(d) { return d.quantity; });Responsiveness
The general method for making D3 charts responsive is to scale the SVG down proportionally as the window gets smaller by manipulating the
viewBoxandpreserveAspectRatioattributes. But after digging around on Github for a while, I found a fancier solution that preserves the height and redraws the SVG as the width shrinks.document.addEventListener("DOMContentLoaded", resize); d3.select(window).on('resize', resize); function resize() { console.log('----resize function----'); // update width width = parseInt(d3.select('#chartID').style('width'), 10); width = width - margin.left - margin.right; height = parseInt(d3.select("#chartID").style("height")); height = height - margin.top - margin.bottom; console.log('----resiz width----'+width); console.log('----resiz height----'+height); // resize the chart xScale.range([0, width]); xScale.rangeRoundBands([0, width], .03); yScale.range([height, 0]); yAxis.ticks(Math.max(height/50, 2)); xAxis.ticks(Math.max(width/50, 2)); d3.select(svgContainer.node().parentNode) .style('width', (width + margin.left + margin.right) + 'px'); svgContainer.selectAll('.bar') .attr("x", function(d) { return xScale(d.food); }) .attr("width", xScale.rangeBand()); svgContainer.selectAll("text") // .attr("x", function(d) { return xScale(d.food); }) .attr("x", (function(d) { return xScale(d.food ) + xScale.rangeBand() / 2 ; } )) .attr("y", function(d) { return yScale(d.quantity) + 1; }) .attr("dy", ".75em"); svgContainer.select('.x.axis').call(xAxis.orient('bottom')).selectAll("text").attr("y",10).call(wrap, xScale.rangeBand()); // Swap the version below for the one above to disable rotating the titles // svgContainer.select('.x.axis').call(xAxis.orient('top')).selectAll("text").attr("x",55).attr("y",-25); }Wrapping text labels
Wrapping text labels is tricky. The best solution I found is the one Mike Bostock (D3’s creator) describes. I modified it slightly to work with my chart, but the overall solution is the same.
function wrap(text, width) {
  text.each(function() {
    var text = d3.select(this),
        words = text.text().split(/\s+/).reverse(),
        word,
        line = [],
        lineNumber = 0,
        lineHeight = 1.1, // ems
        y = text.attr("y"),
        dy = parseFloat(text.attr("dy")),
        tspan = text.text(null).append("tspan").attr("x", 0).attr("y", y).attr("dy", dy + "em");
    while (word = words.pop()) {
      line.push(word);
      tspan.text(line.join(" "));
      if (tspan.node().getComputedTextLength() > width) {
        line.pop();
        tspan.text(line.join(" "));
        line = [word];
        tspan = text.append("tspan").attr("x", 0).attr("y", y).attr("dy", ++lineNumber * lineHeight + dy + "em").text(word);
      }
    }
  });
}
-
Strange issues with stacking on iOS Safari

I was asked to help out with some CSS animation. I thought it would be no problem. A few hours at most. Boy was I wrong.
The biggest issue I ran into was that an element that came in from the right (outside the boundaries was hidden by
overflow) functioned just fine on desktop Safari and Chrome, but did not appear on iOS unless I ran the debugger and toggledoverflowordisplayproperties during the transition.positionandz-indexmade no difference.I came across this article while researching solutions. The ending shed some light for me:
ensure you don’t have a CSS property such as transform on the root element. It’s more than likely that this is creating a new stacking context for the enclosed elements.
Whelp, that sucks. CSS animations rely almost solely on the
transformproperty to operate. I played around a few more hours trying different techniques with containers and positioning. The only thing that sort of worked was usingtranslate3d()and keeping the element active and in view the entire time. Then and only then did it work the same on iOS and desktop. If it paused or was hidden even for a moment, I couldn’t get it to come back.Safari on iOS is doing something funky with stacking when the
transformproperty is involved and I couldn’t find any solid documentation on what is happening in order to come up with a good solution.If anyone has faced this beast and won, please drop me a line! I can’t post the specific elements here because it was client work, but I’m happy to discuss it one-on-one.
Side note: Webkit is finally moving off of prefixes!
-
Having trouble accessing your website from Google’s public DNS? Check your DNSSEC.
I encountered a strange problem today. Someone could access their website from their cell phone but not their laptop and said a friend a few states away also couldn’t reach it. But I could reach it just fine.
When we started digging into what was going on, I found that he was using Google’s public DNS. When I switched to Google’s DNS, I couldn’t reach the site either.
So what is going on here? Apparently Google checks DNSSEC and a lot of other DNS resolvers do not. If it is misconfigured the site won’t resolve.
Here is where you can check your domain’s DNSSEC.
Need a fast and easy way to enable DNSSEC if your registrar doesn’t provide it? Check out Cloudflare.
-
Web crawlers, Regex for Markdown URLs, and Removing your site from Google search results

Today I learned:
Web Crawlers
Need a web crawler but donât want to write one?
- http://scrapinghub.com
- http://www.outwit.com/products/hub/Archived Link
- http://webroots.io
- http://kimonolabs.com
- http://grabby.io
- http://fullcontact.com
- http://emailhunter.co
- http://clearbit.com
- http://toofr.com
- http://import.io
- http://kimonolabs.com
- http://apifier.com
- http://elink.club
- http://www.eliteproxyswitcher.com/
- http://www.uipath.com/
- http://diffbot.com
- http://cloudscrape.com
- http://community.screen-scraper.com
- https://commoncrawl.org/
- http://www.fminer.com/
- https://scraperwiki.com/
- http://nutch.apache.org/
- http://www.ubotstudio.com/index7
- http://mozenda.com
- http://fivefilters.org/
- http://crawly.diffbot.com
Getting pages removed from Google cache
Have an old site that you need to keep live but donât want the results to show on Google searches? Here are a few things you need to do:
- Change the
robots.txtor password protect your site to prevent search engines from indexing. - Log in to Google Webmaster Tools and submit the site to the URL Removal tool.
- Finish what you need the site up for ASAP and take it offline.
Regex for various turning URLs into links in Markdown
This matches the links above:
- Search:
([wS]*[mo7b/])$ - Replace:
[1](1)
-
Circular Progress Bar Count Up with Javascript
I took the Javascript date difference counter from a few weeks ago and added a circular progress bar to it with ProgressBar.js.
In the
days.animatesection, I make sure to prevent the circle from ever reaching 100%. It will get extremely close as the years pass and the numerator comes closer and closer to the denominator, but the denominator will always be slightly larger. Thanks to Eric Davis for helping me come up with the solution.Javascript Counter with circular progress
The results:
The javascript, which counts the time since a certain date:
var elements = document.getElementById('s'); var elementm = document.getElementById('m'); var elementh = document.getElementById('h'); var elementd = document.getElementById('d'); var seconds = new ProgressBar.Circle(elements, { duration: 200, color: "#DC242F", trailColor: "#ddd", strokeWidth: 5, trailWidth: 3 }); var minutes = new ProgressBar.Circle(elementm, { duration: 200, color: "#7FD0E5", trailColor: "#ddd", strokeWidth: 5, trailWidth: 3 }); var hours = new ProgressBar.Circle(elementh, { duration: 200, color: "#F5BB6A", trailColor: "#ddd", strokeWidth: 5, trailWidth: 3 }); var days = new ProgressBar.Circle(elementd, { duration: 200, color: "#4598C9", trailColor: "#ddd", strokeWidth: 5, trailWidth: 3 }); shortcode_date = '2016-04-11T11:00:00' setInterval(function() { now = new Date(); countTo = new Date(shortcode_date); difference = (now-countTo); var second = Math.floor((((difference%(60*60*1000*24))%(60*60*1000))%(60*1000))/1000*1); seconds.animate(second / 60, function() { seconds.setText(""number">" + second + "" + ""label">Seconds"); }); }, 1000); setInterval(function() { now = new Date(); countTo = new Date(shortcode_date); difference = (now-countTo); var minute = Math.floor(((difference%(60*60*1000*24))%(60*60*1000))/(60*1000)*1); minutes.animate(minute / 60, function() { minutes.setText(""number">" + minute + "" + ""label">Minutes"); }); }, 1000); setInterval(function() { now = new Date(); countTo = new Date(shortcode_date); difference = (now-countTo); var hour = Math.floor((difference%(60*60*1000*24))/(60*60*1000)*1); hours.animate(hour / 24, function() { hours.setText(""number">" + hour + "" + ""label">Hours"); }); }, 1000); setInterval(function() { now = new Date(); countTo = new Date(shortcode_date); difference = (now-countTo); var day = Math.floor(difference/(60*60*1000*24)*1); days.animate(day / (day + 5), function() { days.setText(""number">" + day + "" + ""label">Days"); }); }, 1000);The elements it targets: