
Month: October 2016
-
Sol LeWitt’s Wall Drawing 289 with D3.js Transitions
 Read more…: Sol LeWitt’s Wall Drawing 289 with D3.js Transitions
Implementing Sol LeWitt’s Wall Drawing 289 with D3.js transitions, randomization, and responsiveness.
-
Sol LeWitt’s Wall Drawing 86 with D3.js Transitions
 Read more…: Sol LeWitt’s Wall Drawing 86 with D3.js Transitions
Implementing Sol LeWitt’s Wall Drawing 86 with D3.js transitions, randomization, and responsiveness.
-
Sol LeWitt’s Wall Drawing 87 with D3.js Transitions
 Read more…: Sol LeWitt’s Wall Drawing 87 with D3.js Transitions
Exploring Sol LeWitt’s Wall Drawing 87 with D3.js transitions.
-
Praxis Data Workshop – Telling a Stronger Story with Data Visualization
 Read more…: Praxis Data Workshop – Telling a Stronger Story with Data Visualization
The video, slides, and notes from my Praxis workshop on data analysis and visualization.
-
Sol LeWitt’s Wall Drawing 391 with D3.js
 Read more…: Sol LeWitt’s Wall Drawing 391 with D3.js
Design decisions and notes I made in implementing Sol LeWitt’s Wall Drawing 391 with D3.js.
-
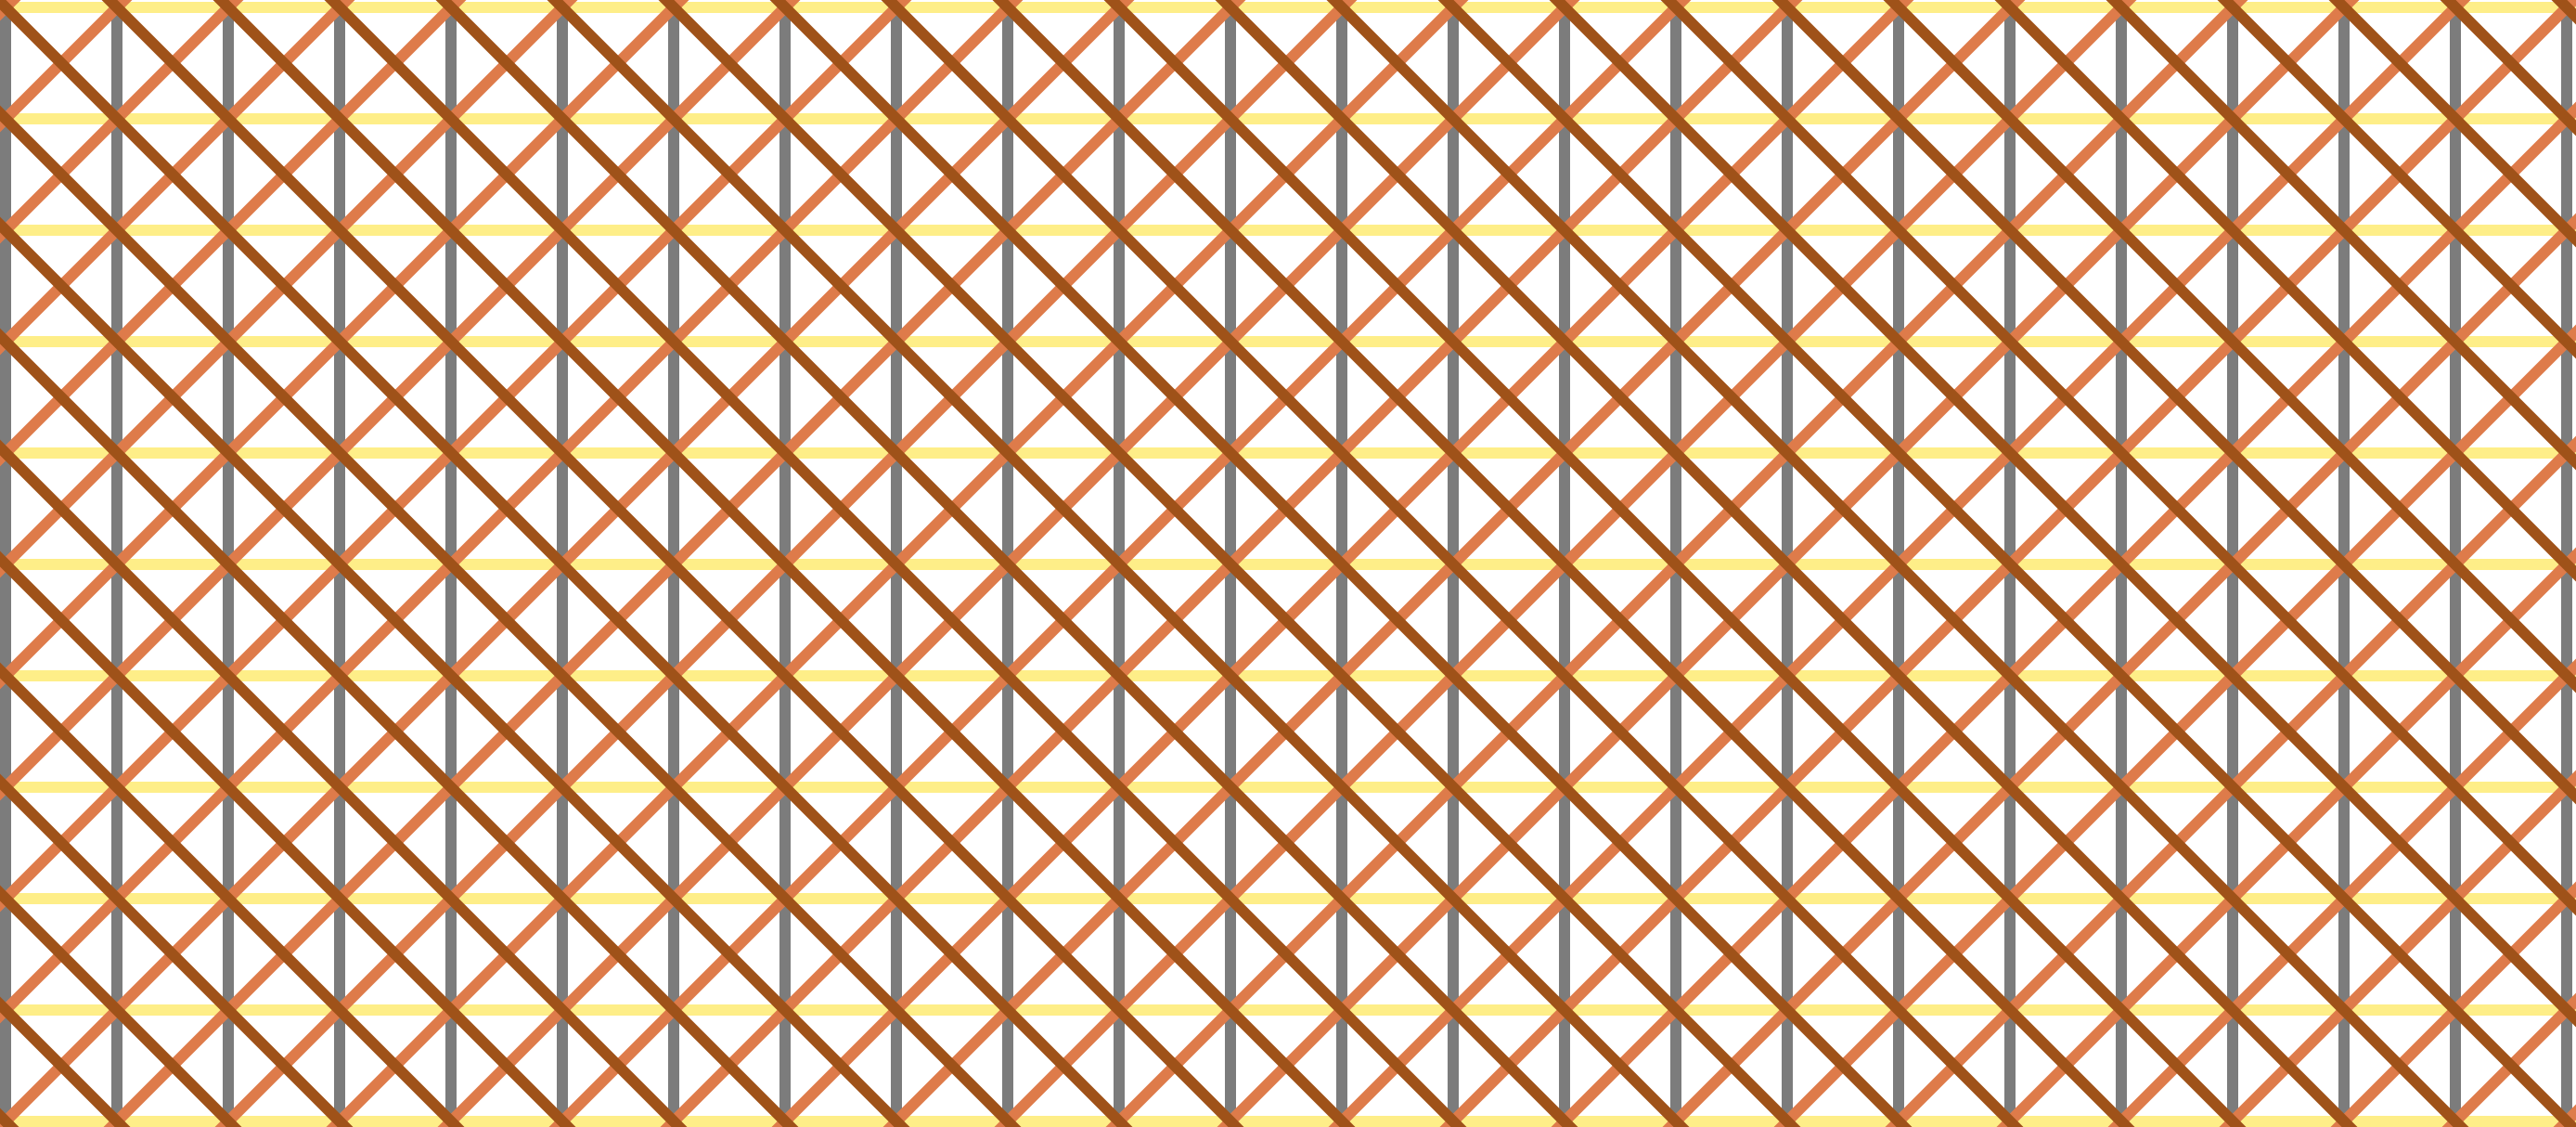
Sol LeWitt’s Wall Drawing 11 with D3.js
 Read more…: Sol LeWitt’s Wall Drawing 11 with D3.js
Design decisions and notes I made while implementing Sol LeWitt’s Wall Drawing 11 with D3.js.
-
Sol LeWitt’s Wall Drawing 56 with D3.js
 Read more…: Sol LeWitt’s Wall Drawing 56 with D3.js
My first attempt at implementing Sol LeWitt’s work on the web! Here are the design decisions and notes I made while implementing Sol LeWitt’s Wall Drawing 56 with D3.js.