

Aren’t familiar with Sol LeWitt or his art? Read this.
Wall Drawing 289: A 6-inch (15 cm) grid covering each of the four black walls. White lines to points on the grids. Fourth wall: twenty-four lines from the center, twelve lines from the midpoint of each of the sides, twelve lines from each corner. (The length of the lines and their placement are determined by the drafter.)
Here is a gfycat preview:
Open my D3 implementation of Wall Drawing 289 in a new window →
It is also available as a block.
Design Details
- LeWitt’s instructions dictate that the lines are to go to a point on a 6-inch grid. I didn’t lay out a grid first, but I did round the random line ending points to they land on whole numbers.
- I chose to conform this to the size of the viewer’s window and have each display randomly generated, so each viewer will have a unique experience.
- Just as the size of the wall this piece was implemented on determined the density of the lines, the size of the window will determine the density. You can try out different densities by resizing the screen. The illustration will rebuild after you resize the window.
- I tried drawing each line individually in time like I did with number 86, but it looked so much cooler with all lines coming in at one from their starting points. The viewer gets the understanding of where each line starts and the randomly-generated end points fulfill the requirement of the length and location of the lines being determined by the drafter.
Technical Details
- The midpoints are determined by the size of the window.
- Each viewer gets a unique experience because the length of the lines is set at random on each page load.
The underlying data set
So much of implementing these drawings with D3.js rely on making a solid, usable data set to join elements with. (After all, D3 stands for data-driven-documents.) Creating these data sets is where I spend most of my time. Once I’ve created them, everything else follows pretty quickly. Here is the function I wrote to create the underlying data set on this piece:
function getRandomArbitrary(min, max) { return Math.round(Math.random() * (max - min) + min); } function lineData() { var data = new Array(); var id = 1; var ww = window.innerWidth; var wh = window.innerHeight; var numLines = 12; // iterate for cells/columns inside rows for (var center = 0; center < numLines * 2; center++) { data.push({ id: id, class: "center", x1: ww/2, y1: wh/2, x2: getRandomArbitrary(0, ww), y2: getRandomArbitrary(0, wh) }) id++; } for (var topleft = 0; topleft < numLines; topleft++) { data.push({ id: id, class: "topleft", x1: 0, y1: 0, x2: getRandomArbitrary(0, ww), y2: getRandomArbitrary(0, wh) }) id++; } for (var topright = 0; topright < numLines; topright++) { data.push({ id: id, class: "topright", x1: ww, y1: 0, x2: getRandomArbitrary(0, ww), y2: getRandomArbitrary(0, wh) }) id++; } for (var bottomright = 0; bottomright < numLines; bottomright++) { data.push({ id: id, class: "bottomright", x1: ww, y1: wh, x2: getRandomArbitrary(0, ww), y2: getRandomArbitrary(0, wh) }) id++; } for (var bottomleft = 0; bottomleft < numLines; bottomleft++) { data.push({ id: id, class: "bottomleft", x1: 0, y1: wh, x2: getRandomArbitrary(0, ww), y2: getRandomArbitrary(0, wh) }) id++; } for (var middleleft = 0; middleleft < numLines; middleleft++) { data.push({ id: id, class: "middleleft", x1: 0, y1: wh/2, x2: getRandomArbitrary(0, ww), y2: getRandomArbitrary(0, wh) }) id++; } for (var middleright = 0; middleright < numLines; middleright++) { data.push({ id: id, class: "middleright", x1: ww, y1: wh/2, x2: getRandomArbitrary(0, ww), y2: getRandomArbitrary(0, wh) }) id++; } for (var middletop = 0; middletop < numLines; middletop++) { data.push({ id: id, class: "middletop", x1: ww/2, y1: 0, x2: getRandomArbitrary(0, ww), y2: getRandomArbitrary(0, wh) }) id++; } for (var middlebottom = 0; middlebottom < numLines; middlebottom++) { data.push({ id: id, class: "middlebottom", x1: ww/2, y1: wh, x2: getRandomArbitrary(0, ww), y2: getRandomArbitrary(0, wh) }) id++; } return data; } Transition
I handled the transition by first defining the lines as starting and ending at the same set of coordinates, then doing a delayed transition to their real end points:
var line = svg.selectAll(".rand") .data(lineData) .enter().append('line') .attr("class", function(d) { return d.class; }) .attr("id", function(d) { return d.id; }) .attr("x1", function(d) { return d.x1; } ) .attr("y1", function(d) { return d.y1; }) .attr("x2", function(d) { return d.x1; } ) .attr("y2", function(d) { return d.y1; }).transition().duration(3000) .attr("x2", function(d) { return d.x2; }) .attr("y2", function(d) { return d.y2; });Rebuilding on screen resize
When you resize the screen, the svg gets destroyed and then rebuilt based on the new screen size. New midpoints are calculated and new ending points for each other lines are calculated. Here is the function I use to handle that. It is the same thing I used on 86 and on my Jekyll posts heatmap calendar. I wrapped the D3 instructions in its own function, called that function on first load, then wrote a function to destroy the svg when the screen is resized and reexecute the D3 instructions after the screen resize ends. I’m sure it can be done with regular javascript, but jQuery makes this kind of thing fast and easy:
// run on first load sol289(); $(window).resize(function() { if(this.resizeTO) clearTimeout(this.resizeTO); this.resizeTO = setTimeout(function() { $(this).trigger('resizeEnd'); }, 500); }); //resize on resizeEnd function $(window).bind('resizeEnd', function() { d3.selectAll("svg").remove(); sol289(); });Want to dig in a little further? Check out my implementation and view source. All of the specs are there.
Tools Used
- D3.js – The D3.js library is well-suited to Sol LeWitt’s early works. D3’s foundational principle of joining data to elements is easy to apply to LeWitt’s symmetrical objects.
- jQuery – I’m using jQuery to detect changes in the window size and trigger removing & rebuilding the visualization.
Inspiration and References
- Wall Drawing 289 at MASSMoCA
- Page 158 in Sol LeWitt: 100 Views
Detail shot of the version on display at MASSMoCA: 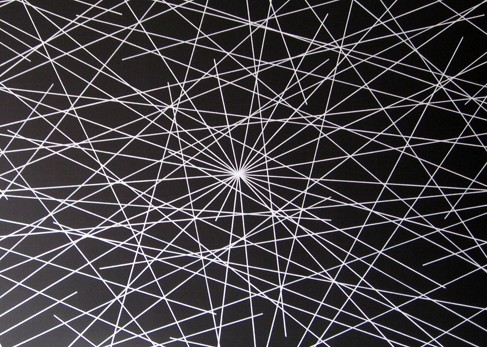
Leave a Reply