

I took a static infographic made by a client in Illustrator and applied some web magic to make it animated and interactive. Along the way I developed stronger JavaScript, jQuery, and CSS animation skills.
Note: I made this for a client of eResources, my current employer.
Project and Challenges:
- A client came to us with a pre-designed infographic made in Illustrator. They wanted it to be interactive, sharable, and viewable on the web.
- We had a limited number of hours we could use. This didn’t include enough time for making the infographic fully responsive, so we needed to get creative with how it would work on mobile.
What I learned:
- Structuring code in a clean, readable way
- Pre-development sketching of outlines
- CSS animation with keyframes
- Nuances of layering containers and using selectors in CSS.
- Giving content sections a parallax effect
- Positioning elements by the page’s scroll position
- jQuery for clicking and toggling actions
- Open Graph and Twitter Card metadata
- Making custom share URLs with encoded pre-populated data
- Using Javascript to check User Agents to determine whether or not Skrollr should fire (it doesn’t play well with iOS)
View the finished product in action! →
Third-party tools used
- Skrollr to drive parallax and positioning elements by the page’s scroll position
- Wow.js for triggering CSS animations
- Animate.css so I didn’t have to write all of the CSS animations from scratch
- Chart.js for rendering the pie charts and making them interactive
- jQuery for clicking and toggling actions
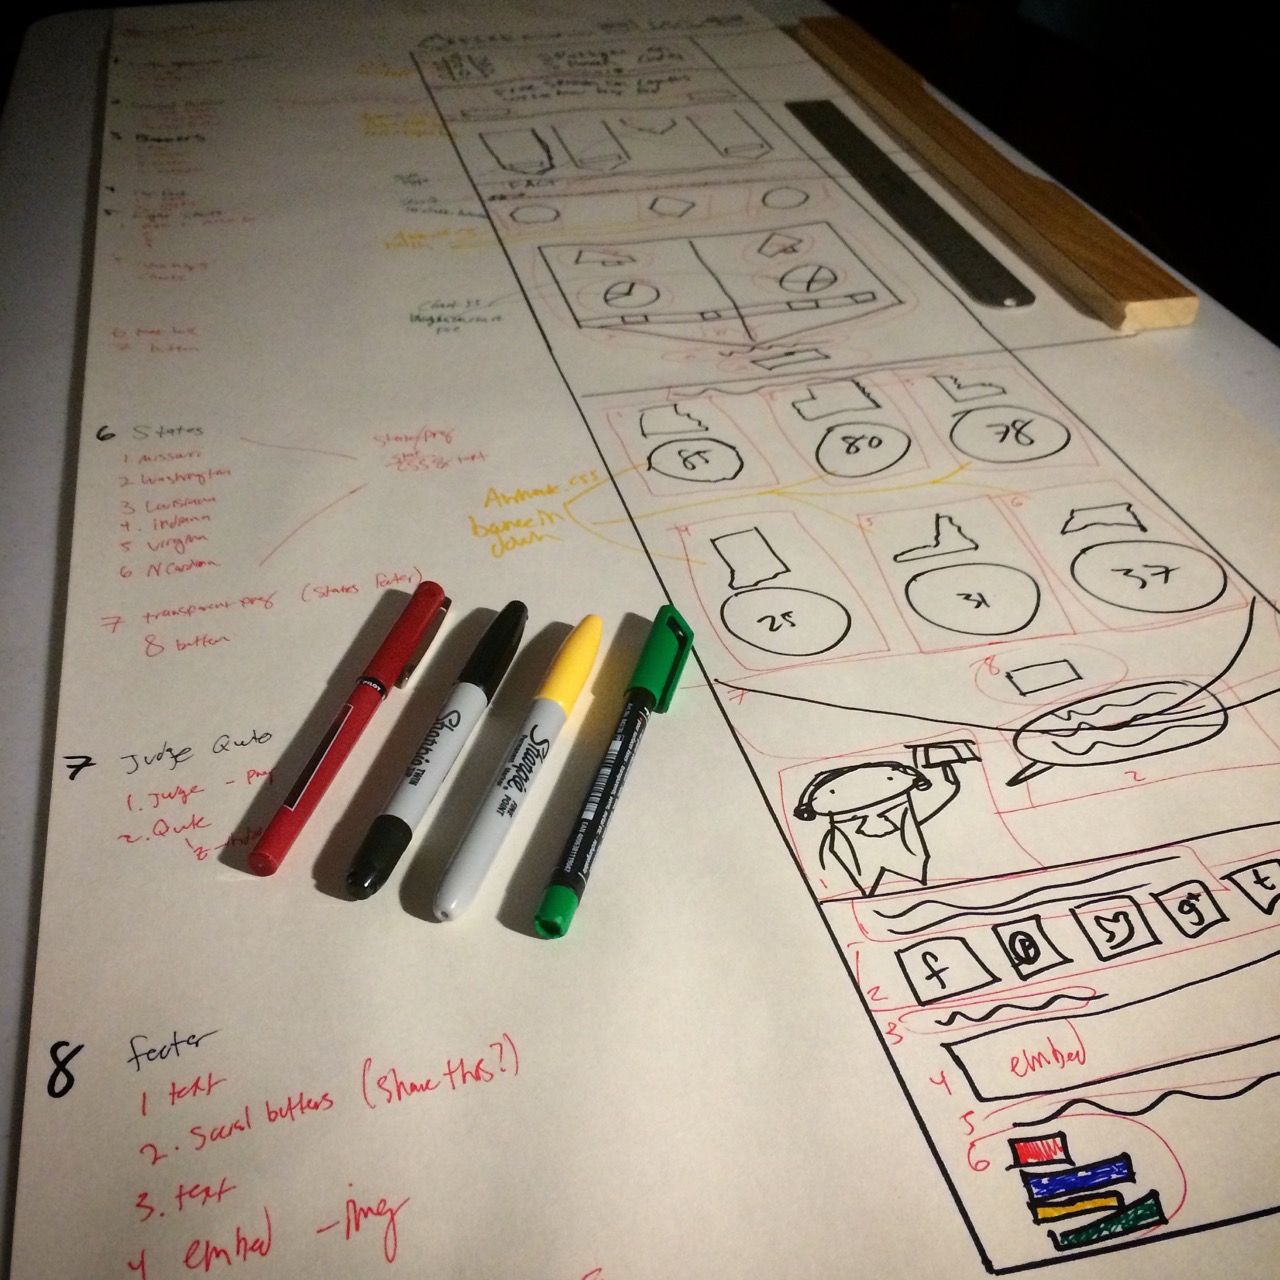
In-Progress Photos
I first sketched the infographic out on an IKEA drawing paper roll to plan out where elements should go and how to structure the code overall.
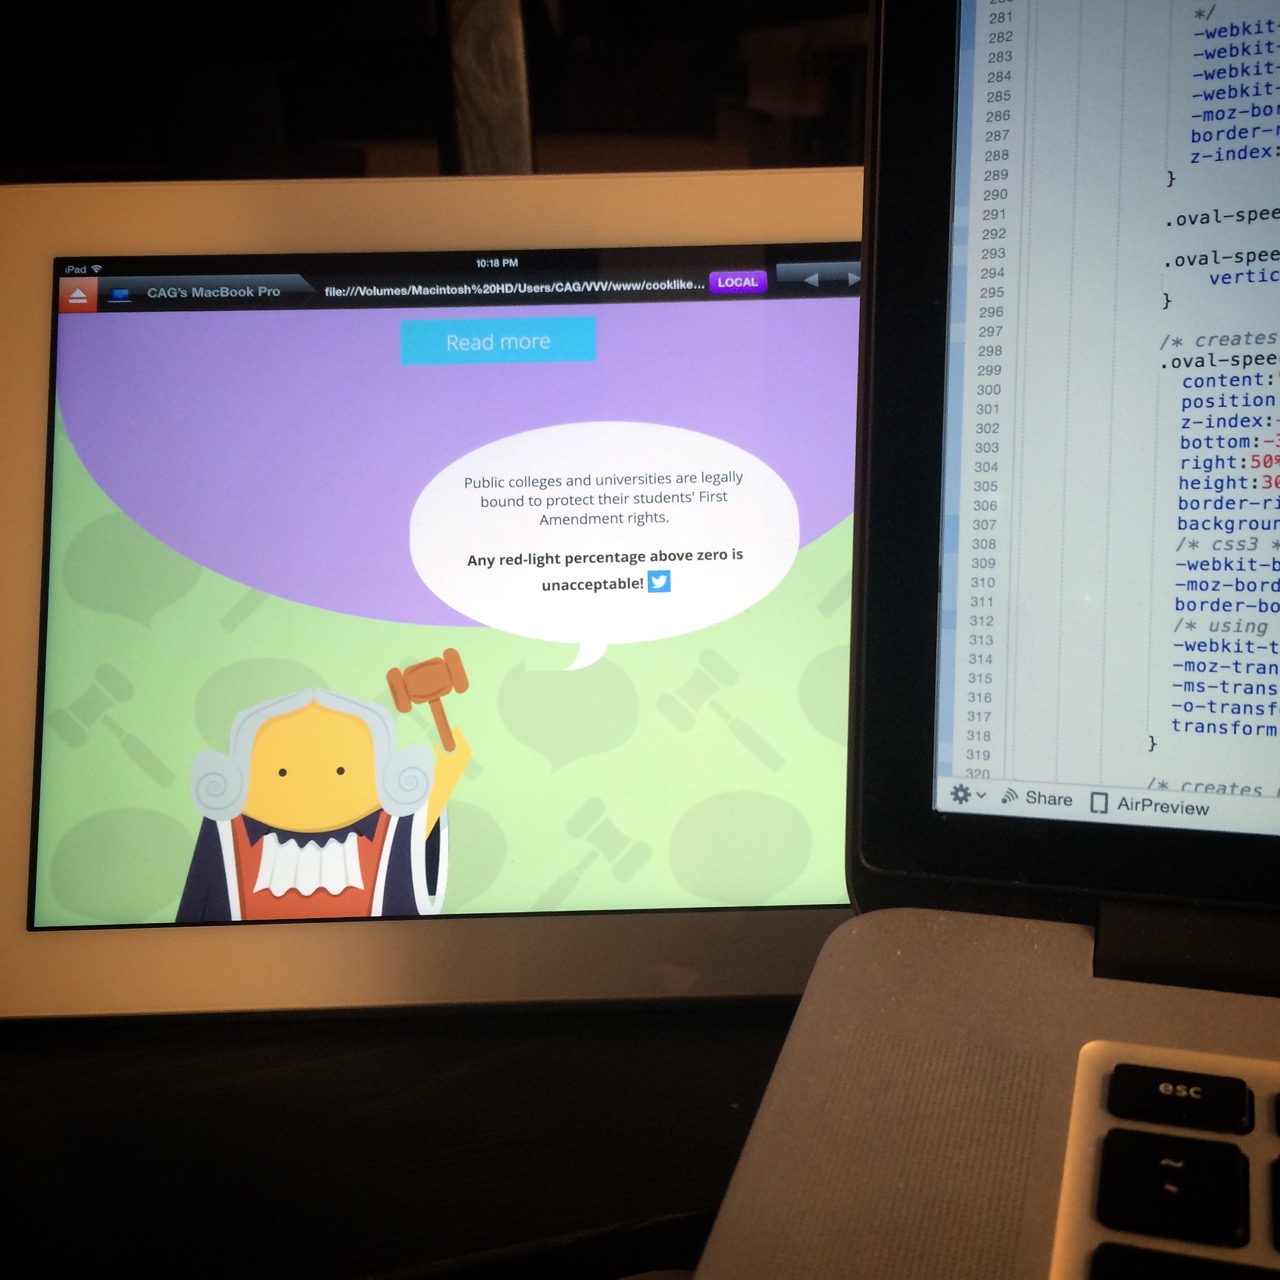
As I wrote the code, I previewed and tested it in real-time with Coda’s AirPreview.
View the finished product in action! →
Original image:

Leave a Reply