
I’m working my way through some data science and visualization books right now. I found that I learn better by doing small projects than I do by copying examples in books, so I designed a little project to apply some of what I learned and to learn some new skills along the way.
My goal was to make a project where I do everything from start to finish: Create my own data set, format it, analyze it, then visualize it. I also wanted to make it fairly common and as automated as possible so it could be repeated by others.
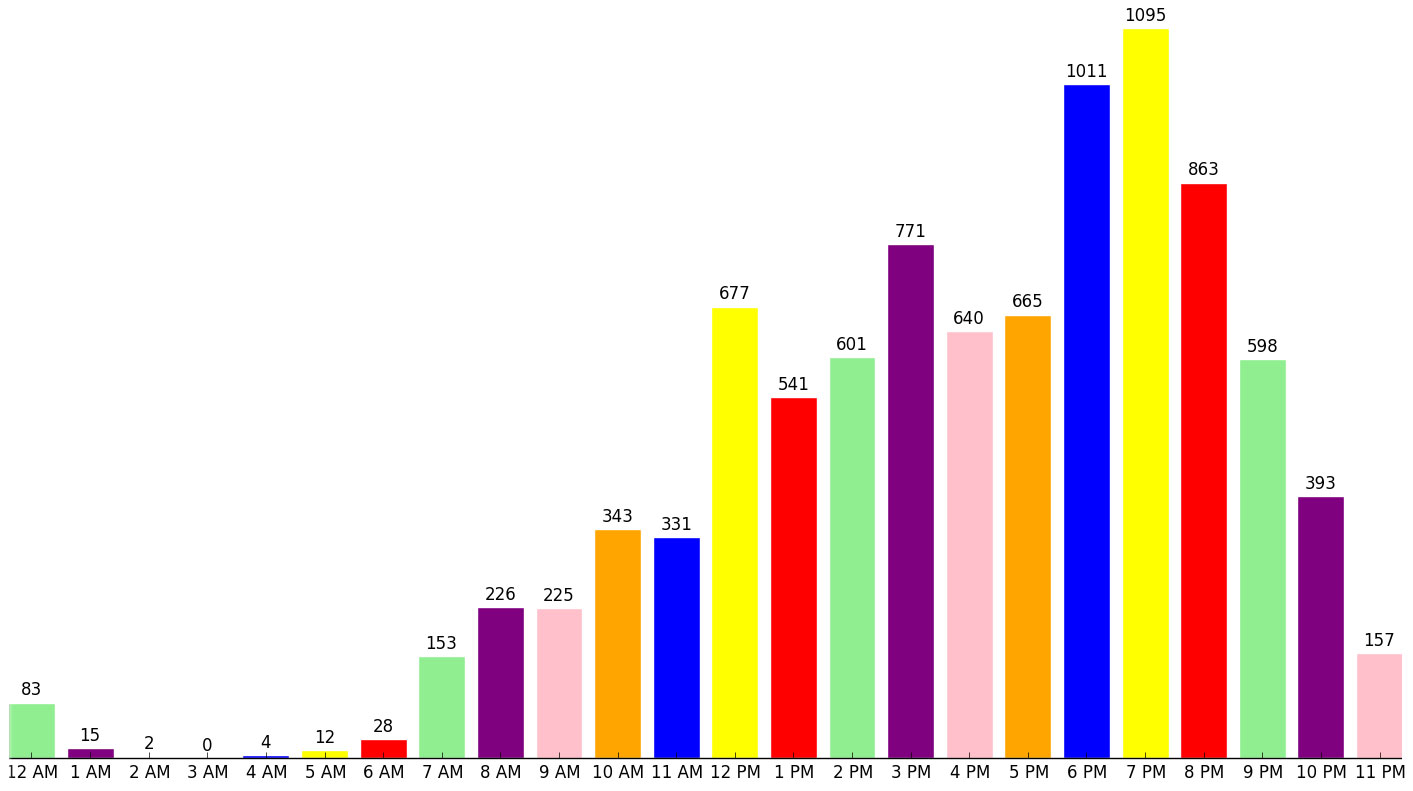
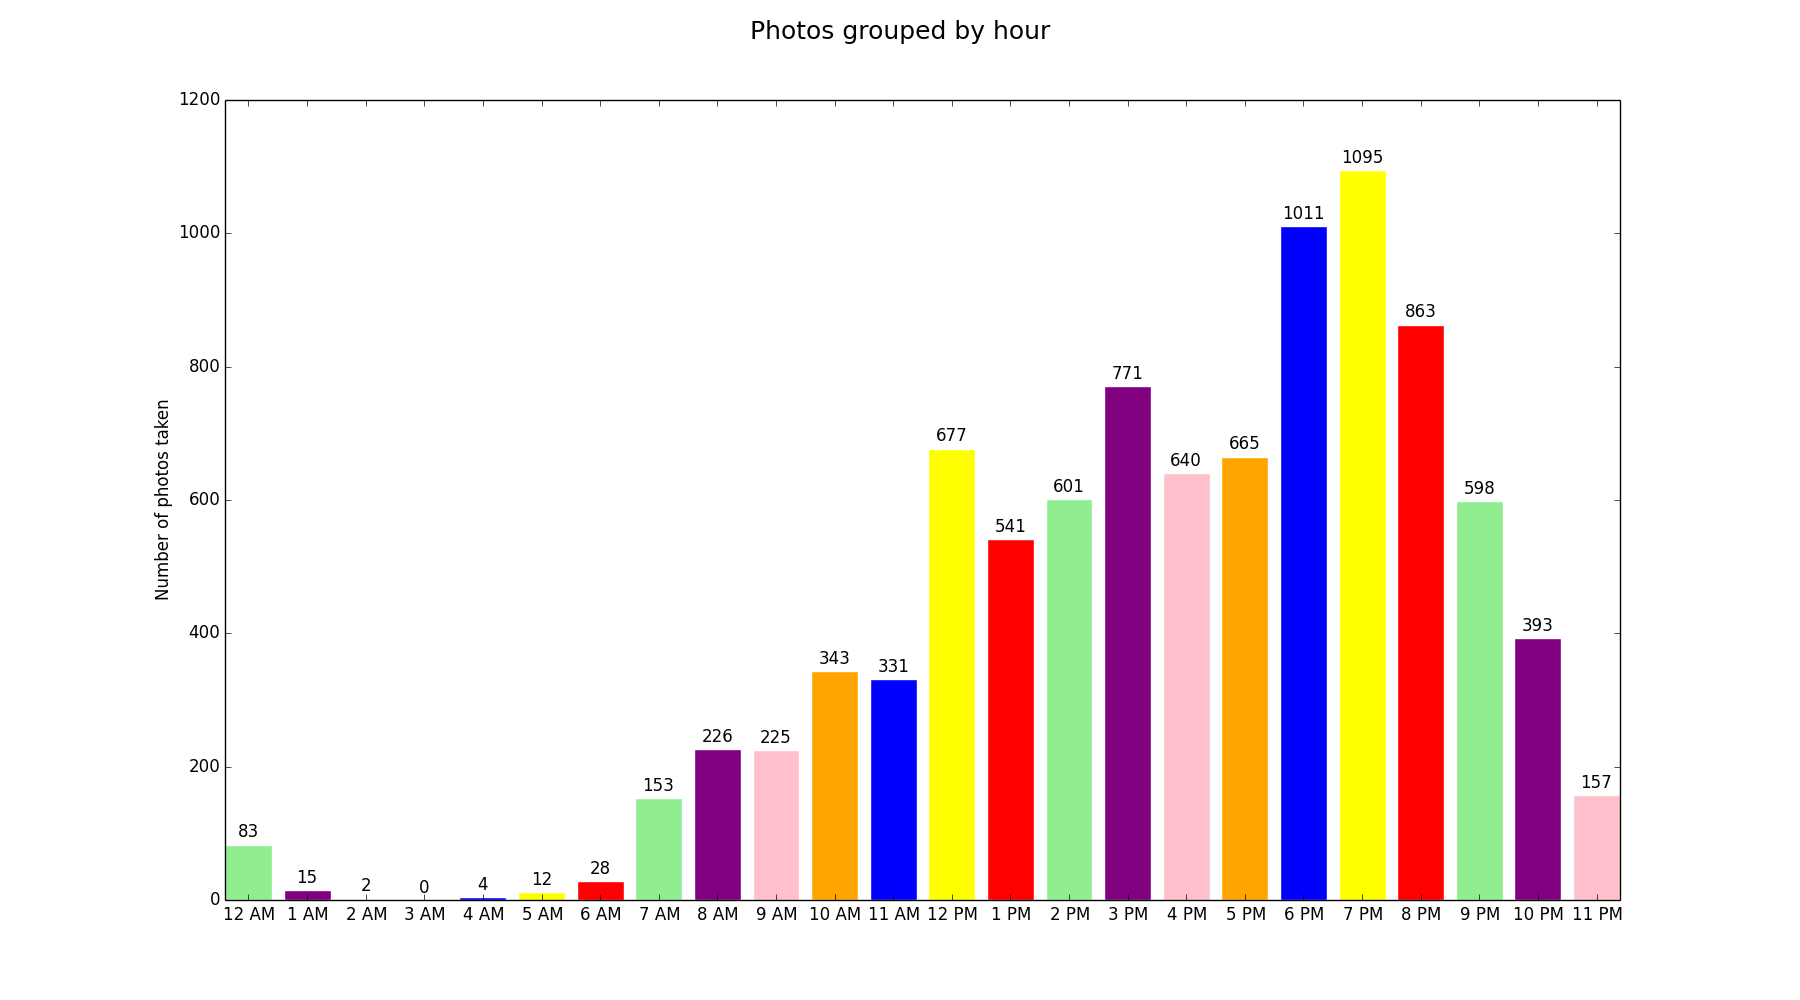
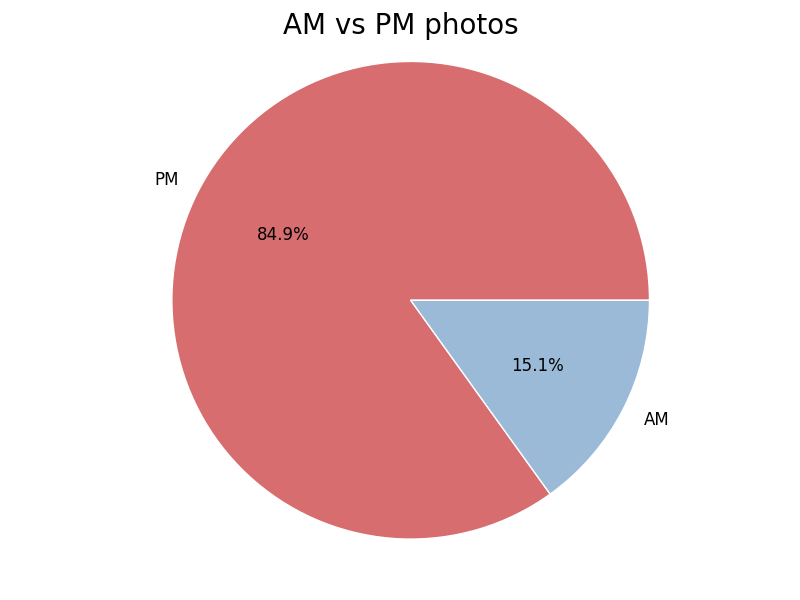
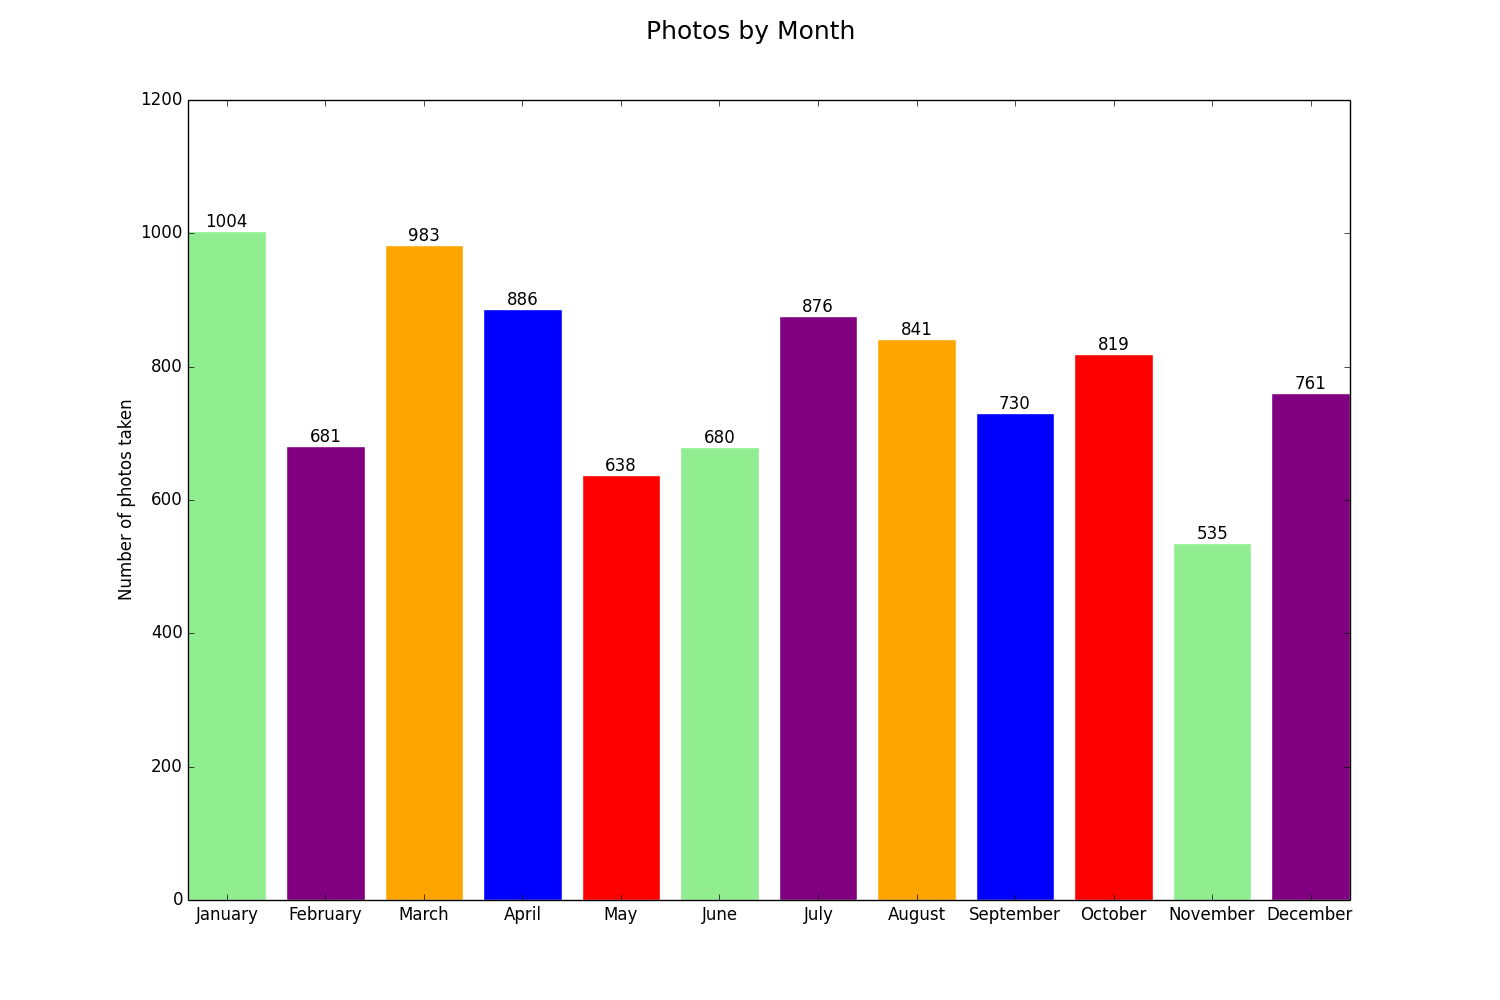
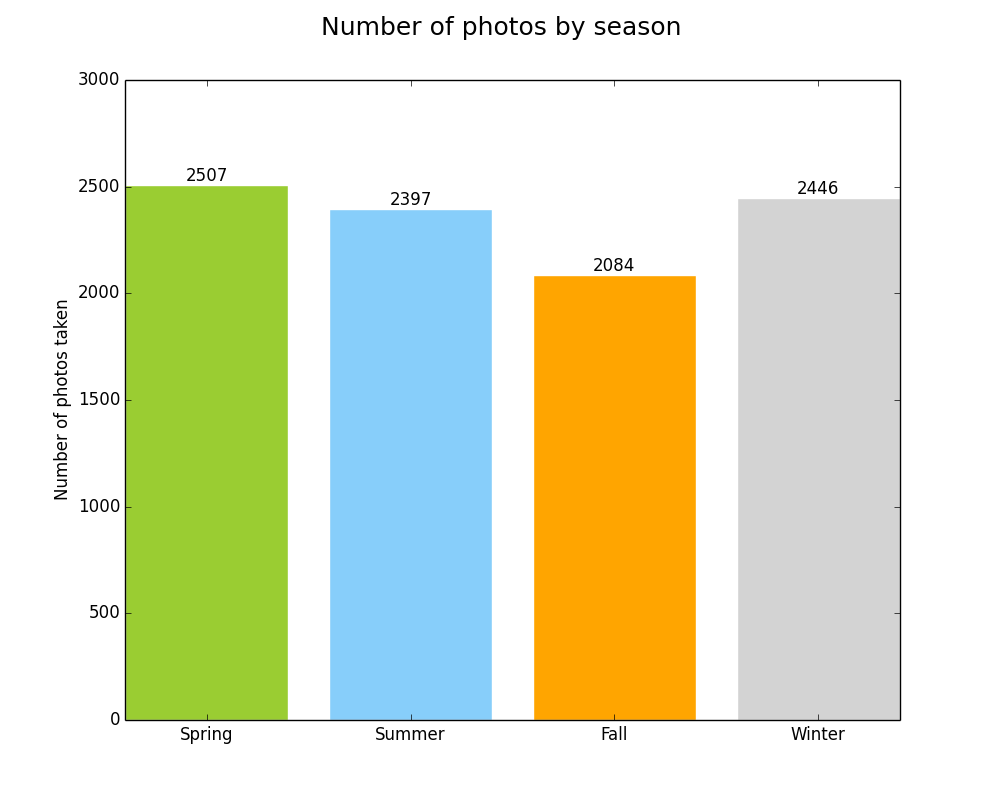
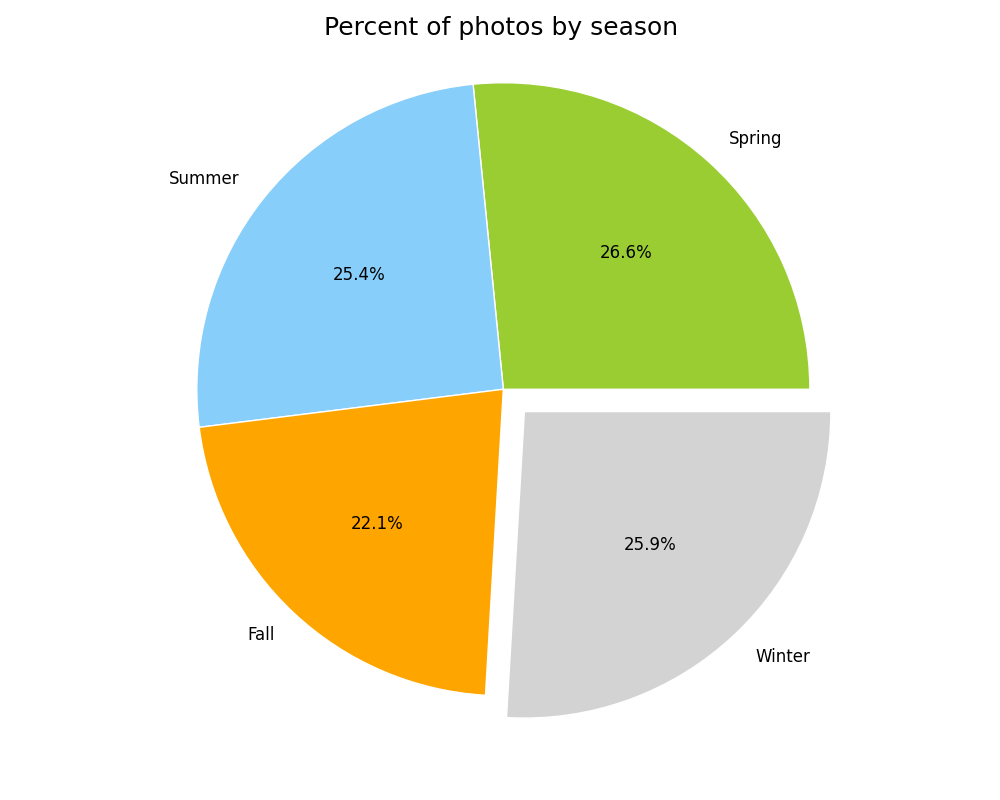
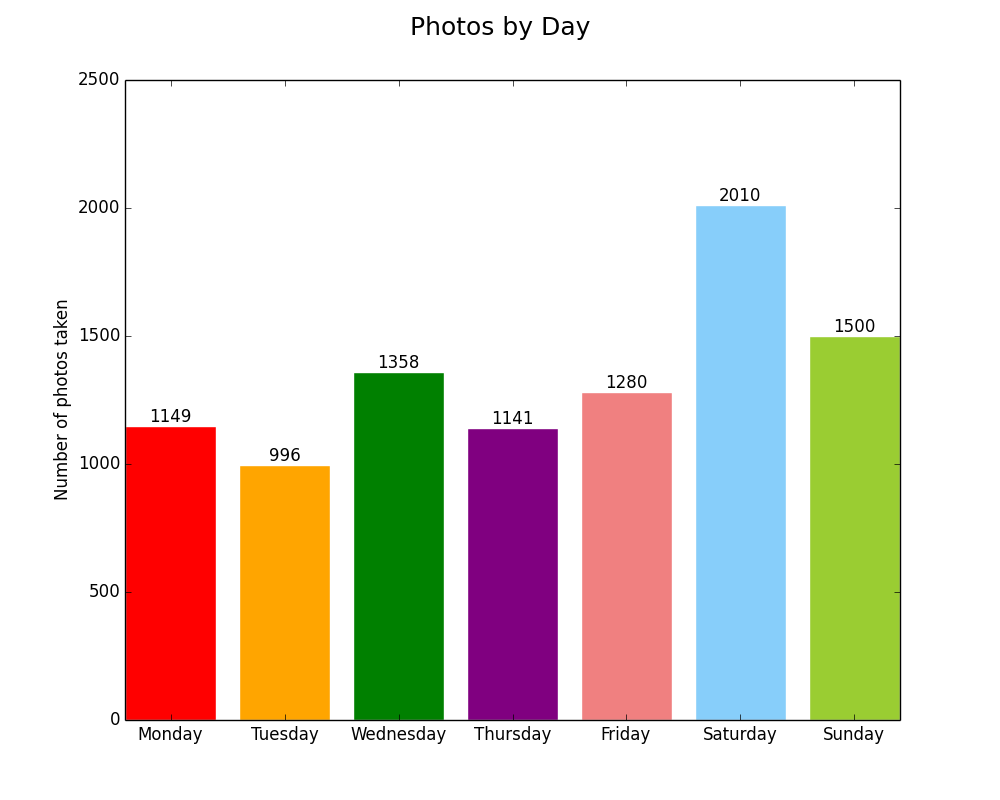
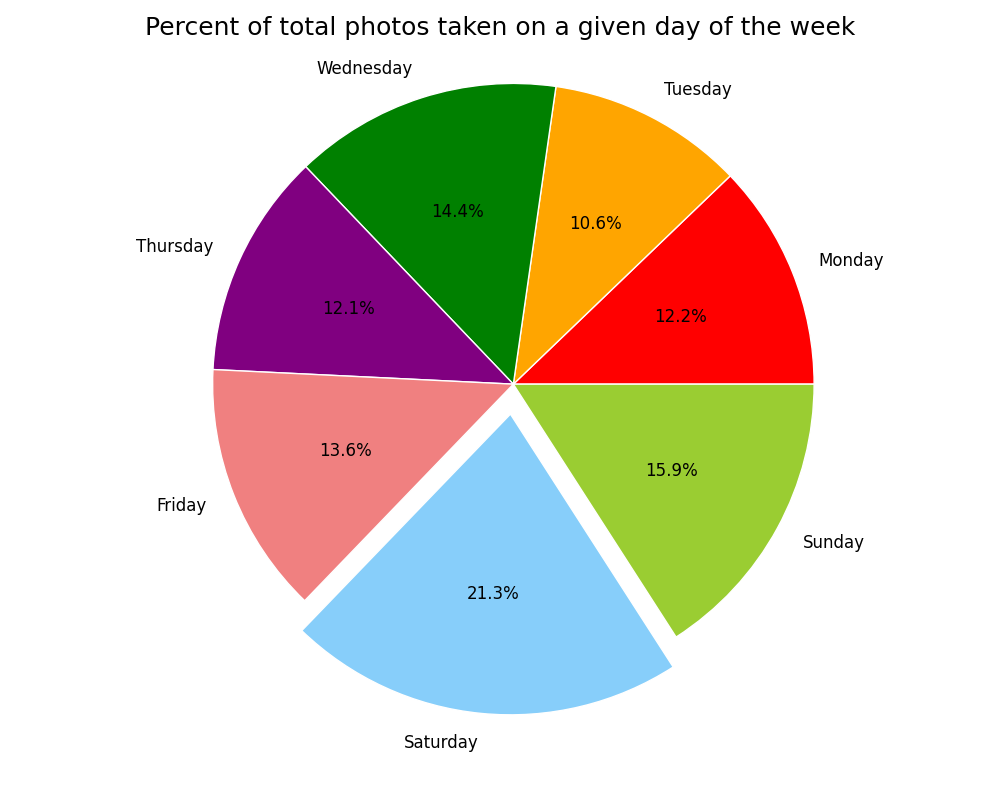
Here is what I came up with: Extracting metadata from my iPhone photos, analyzing it in different ways (days, months, hours, seasons), and visualizing it. I used free tools to do the extraction, formatting, and visualization, then scripted everything with AppleScript and Python to automate it.
Technical Details
You can find the full repository on GitHub. If you have a recent Mac with Photos.app and TextWrangler, you can run the scripts and produce your own charts!
- I used AppleScript to loop through photo metadata in Photos.app and write it out to a CSV files that it creates in the same directory as the scripts.
- I used TextWrangler’s grep functionality via AppleScript to break apart the date strings into days of the week, dates, and times, and to remove bad or null location strings (lat,long). I know I could have written this in Python, but I didn’t want to reinvent the wheel. TextWrangler’s AppleScript library is very powerful and easy to use.
- Python was my tool of choice for analyzing the CSV files in various ways and visualizing the results with one of its plotting libraries, matplotlib.
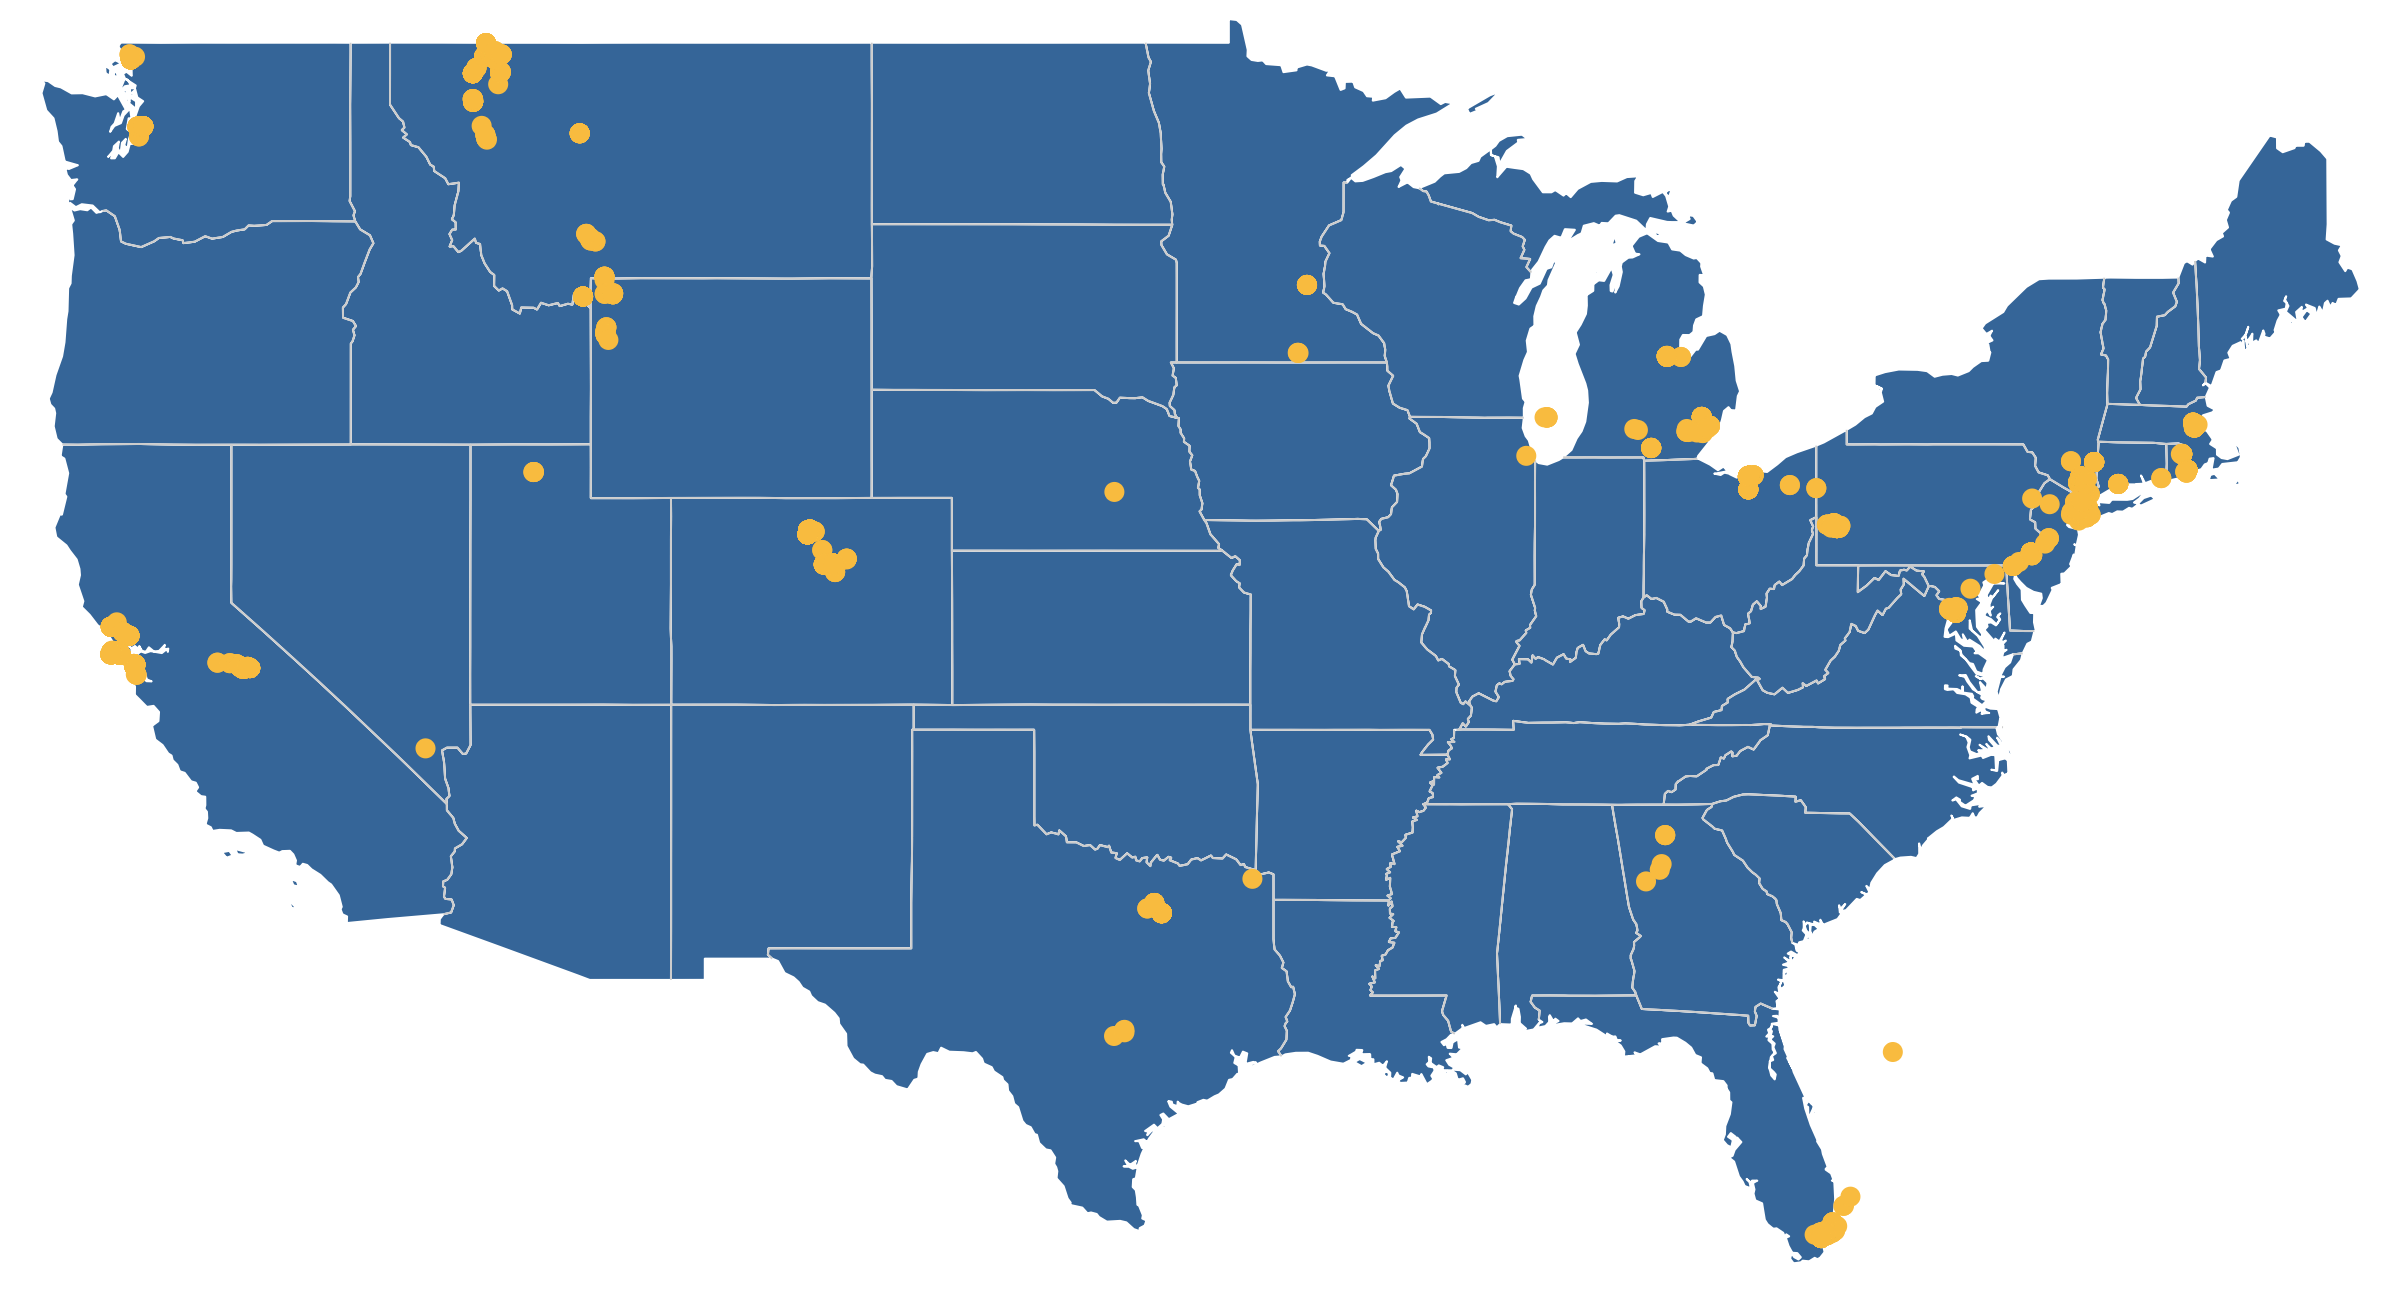
- The map of where photos were taken in the US was generated with D3.js.
- Once everything has been generated and saved, AppleScript opens the images in Preview and launches a simple Python webserver to show the map.
The Results
Lessons
- I really beefed up my understanding of basic Python (with help from Eric Davis!)
- I dusted off my AppleScript knowledge and gave it a workout. I learned that AppleScript has a concept of lists that you can pass into and out of programs. This was the key to launching all of the charts in a single preview window.
- This was a great exercise in UX. How can this be both easy to use and easy to interpret?
- This was an exercise in thinking programatically. How can this be built in a way that makes it reusable?
- I learned how to project location information onto a map with D3.js. I’ve used D3.js for charts before, so this was a good way to expand my skills.
- This was a good way to practice my git skills and think through how to structure a project and make executable code.
- There is a lot more I can add to this (more mapping options, more ways to count the photos, outputting the photos in a calendar heatmap), but I feel comfortable stopping and moving on because I learned what I wanted to from it and I’m ready to start a new project. I might come back to this in the future and I might not, but either way I’m happy with this.
Cavaets
- This analysis is not scientific, it was for fun. Since my photos were taken with different cell phones across non-controlled time periods, I can’t use this analysis to say things like, “I’m more likely to take photos in the spring than the fall.” The truth is that there are photos in here from three springs but only two falls.
- I can’t guarantee that my code will work for everyone. It is still a little buggy and hasn’t been tested for all scenarios. I know this and know how I would test it, but this project isn’t big enough to warrant it.
- The color palettes I used aren’t bulletproof. If you use F.lux or Night Shift the yellows will blend in to the screen, and if you have visual impairments you might not be able to distinguish between the greens and blues.
Try it for yourself
You can download the repository from GitHub and run it against your Photos.app library. The requirements and instructions are in the README. Let me know if you have any issues and I’ll do my best to help you out.
Leave a Reply