
Today I learned a lot in Python
Get current directory
import os os.getcwd()Reading CSVs in Python
import csv with open('/photo_dates_location.csv') as f: reader = csv.reader(f, delimiter=',', quotechar='"') reader.next() #skip header day_csv = [row[0] for row in reader]Counting in Python
Using Counter to create a list of unique items and counts by appending items to the lists:
import counter days = [] count = [] for (k,v) in Counter(day_csv).iteritems(): days.append(k) count.append(v)Ordering lists with a lambda expression
According to Eric Davis the lambda expressionArchived Link is a good way to make quick expressions on the fly for organizing things like the Counter lists:
day_number = { 'Monday': 1, 'Tuesday': 2, 'Wednesday': 3, 'Thursday': 4, 'Friday': 5, 'Saturday': 6, 'Sunday': 7 } days_sorted = sorted(Counter(day_csv).iteritems(), key=lambda e: day_number[e[0]])Plotting with Python
Given that the lists days and count are built above by the Counter(), you can pass them to matplotlib for charting:
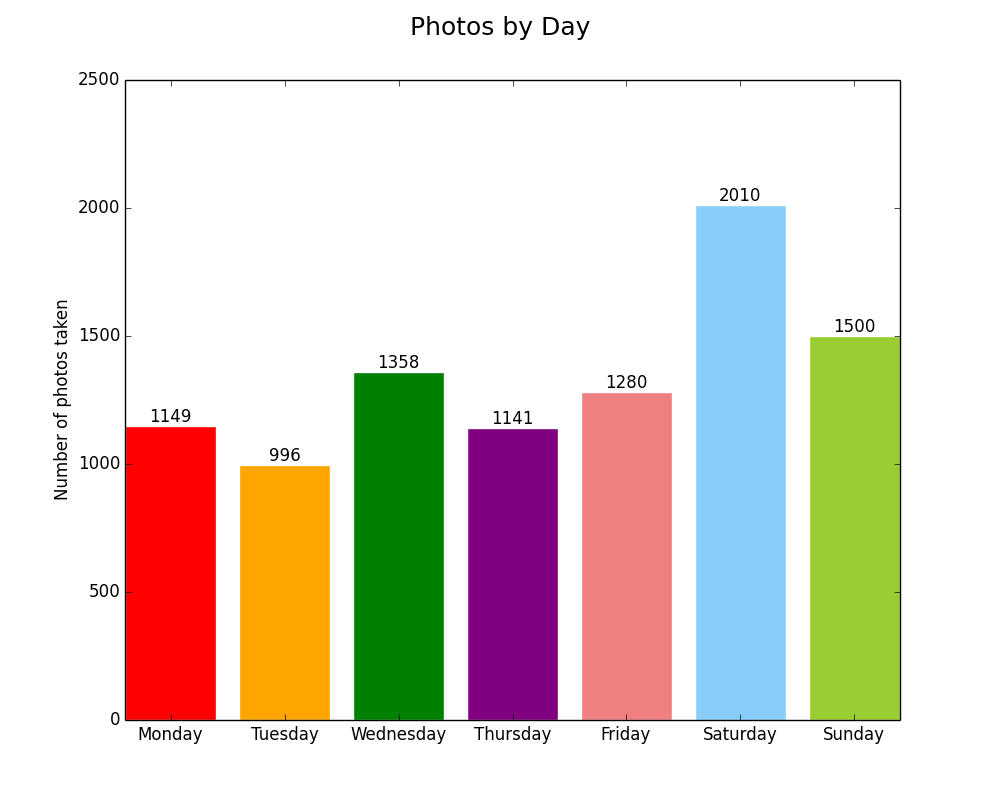
from matplotlib import pyplot as plt ######## Bar Chart ######## xs = [i + 0.1 for i, _ in enumerate(days)] plt.bar(xs, count) plt.ylabel("Number of photos taken") plt.title("Photo frequency by day") plt.xticks([i + 0.5 for i, _ in enumerate(days)], days) plt.savefig('img/weekdays_bar.png') plt.clf() ######## Pie chart ######## colors = ['red', 'orange', 'green', 'purple', 'lightcoral', 'lightskyblue', 'yellowgreen'] explode = [0, 0, 0, 0, 0, 0.1, 0] plt.pie(count, explode=explode, labels=days, colors=colors, autopct='%1.1f%%') plt.axis('equal') plt.suptitle("Percent of total photos taken on a given day of the week", fontsize=18) plt.savefig('img/weekdays_pie.png')- If you donât want to save the images, you could just show them instead with
plt.show() plt.clf()clears the figure so you can plot something else on it. Otherwise youâd need to close it before continuing.plt.close()can do that.
Depending on the source CSV, the above creates these two charts: 

Leave a Reply